Tutorial of RiceVarMap v3.0
- 1. How to search for variations by region?
- 2. How to search for variations in a gene?
- 3. How to search genotype with variation ID?
- 4. How to search for polymorphic positions between two cultivars?
- 5. How to search for variation information with variation ID?
- 6. How to search cultivar information?
- 7. How to search phenotype information?
- 8. How to design primer by using RiceVarMap?
- 9. How to do haplotype network analysis?
- 10. How to convert IDs / coordinates across reference genomes?
- 11. Updated variant resources and annotations in RiceVarMap3
- 12. Deep-learning–based regulatory variant prioritization
- 13. Population differentiation analysis
- 14. RAG-based intelligent natural language query
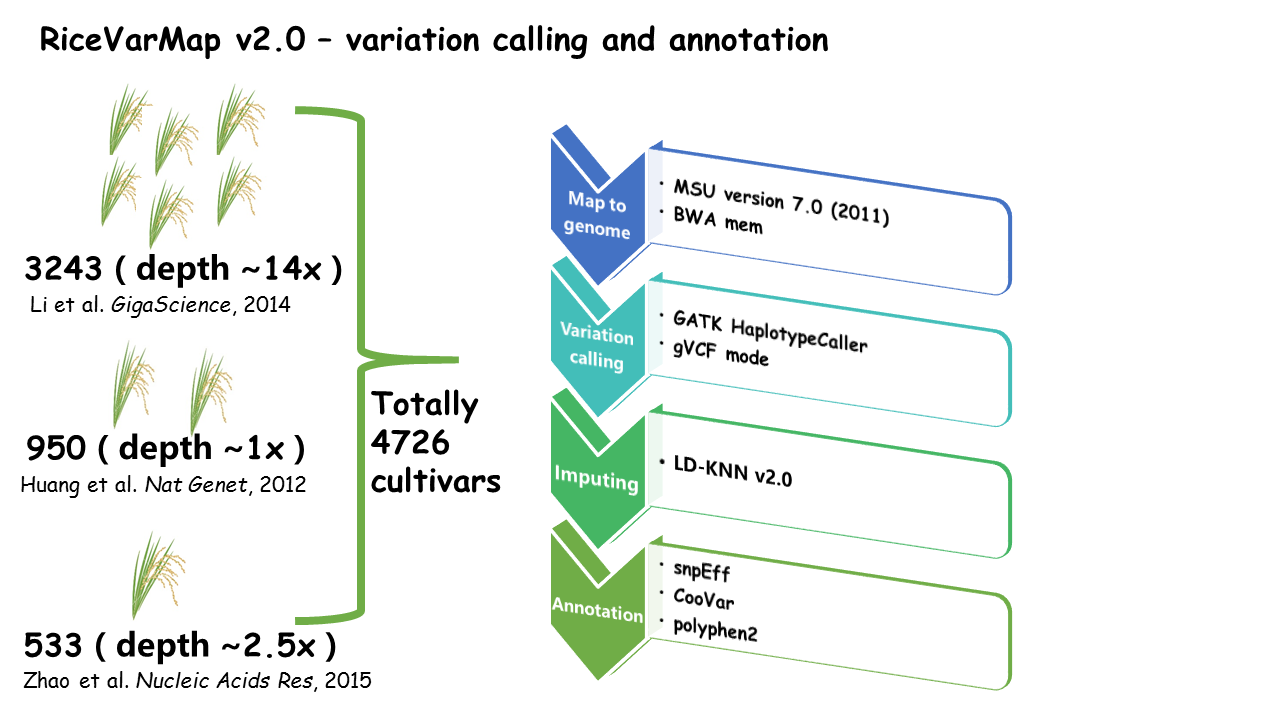
RiceVarMap3 is developed as an upgraded version of RiceVarMap v2, inheriting its core query framework and widely used analysis modules. The classic functions, including Search for Variation by Region, Search for Variation in Gene, and Search for Genotype With Variation ID, remain fully supported. In addition, essential tools such as Design Primer by Region, Design Primer by Variation ID, Haplotype Network Analysis, and regulatory variant scoring modules are preserved and further optimized.
Compared with previous versions, RiceVarMap3 significantly expands variation resources by integrating multi-reference genomic datasets. Variant sites for Nipponbare (NIP; IRGSP-1.0) are derived from the 4K variation dataset, while variant sites for MingHui63 (MH63) and ZhenShan97B (ZS97) are derived from the 3K variation dataset. This multi-reference design enables consistent variant querying, annotation, and comparison across both japonica and indica reference genomes.
RiceVarMap3 integrates large-scale rice variation resources across multiple reference genomes. Specifically, the database includes variant calls for three representative cultivars: Nipponbare (NIP; IRGSP-1.0) based on the 4K dataset, and MingHui63 (MH63; indica) plus ZhenShan97B (ZS97; indica) based on the 3K dataset. Together, these datasets provide a comprehensive catalog of SNPs and small INDELs for multi-reference variant browsing and downstream analysis.
RiceVarMap3 also introduces enhanced functional annotation pipelines. For coding variants, updated consequence annotations and multiple protein-impact predictors are integrated to improve interpretation accuracy. For non-coding variants, the platform incorporates chromatin accessibility signals and deep-learning–based sequence-to-regulatory prediction models trained on multi-tissue datasets, enabling tissue-specific regulatory effect estimation and prioritization of high-impact regulatory variants. Furthermore, new modules for population differentiation analysis and selection signal exploration provide population-aware functional insights.
In addition, RiceVarMap3 introduces an intelligent natural language interface based on retrieval-augmented generation (RAG), which can automatically parse user queries, extract parameters (e.g., genes, genomic regions, populations), and route requests to the corresponding functional modules. Background of data collection, processing, and evaluation can be found in the Notes and Data Evaluation page.
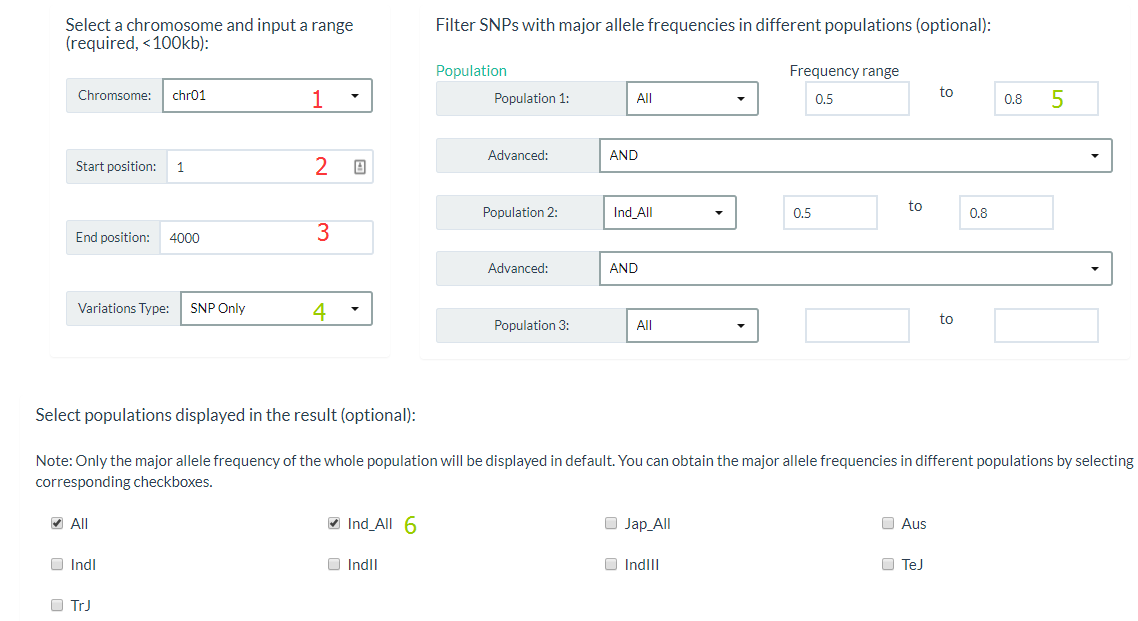
1. How to search for variations by region? top
You can click this link, specify a chromosome and input a range (required), and also you can filter Variations by major allele frequencies (optional). For results display, you can select only output SNP or INDEL and populations major allele frequencies in this region.
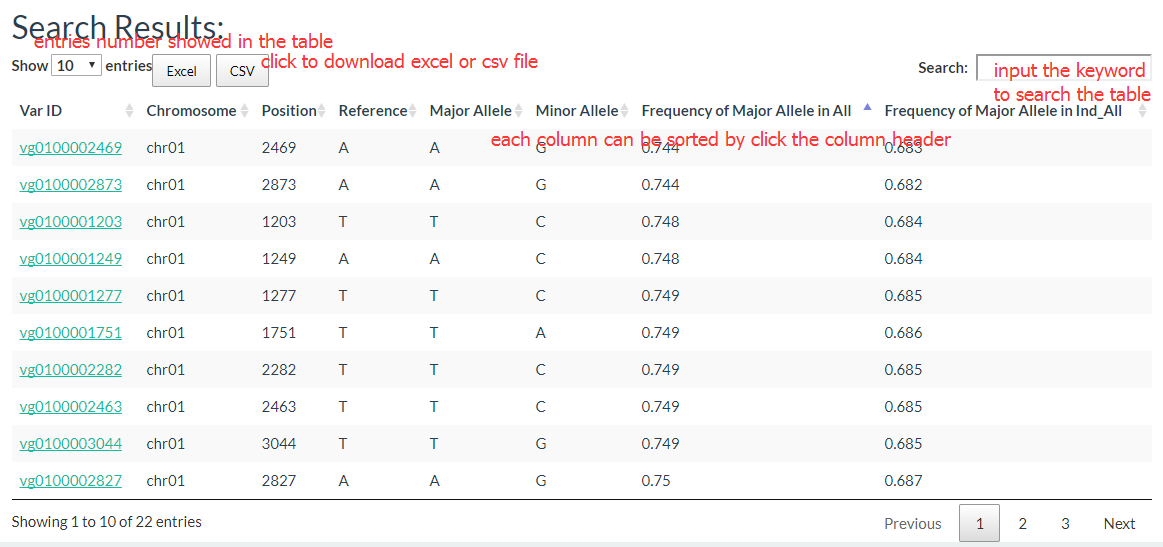
The results show like this:
2. How to search for variations in a gene? top
You can click this link, and enter one gene Loci or gene symbol (e.g. LOC_Os01g01070), and to search for variation in upstream or downstream regions, enter the distance upstream or downstream of the gene (e.g., 0.5 kb upstream, 0.2 kb downstream, optional).
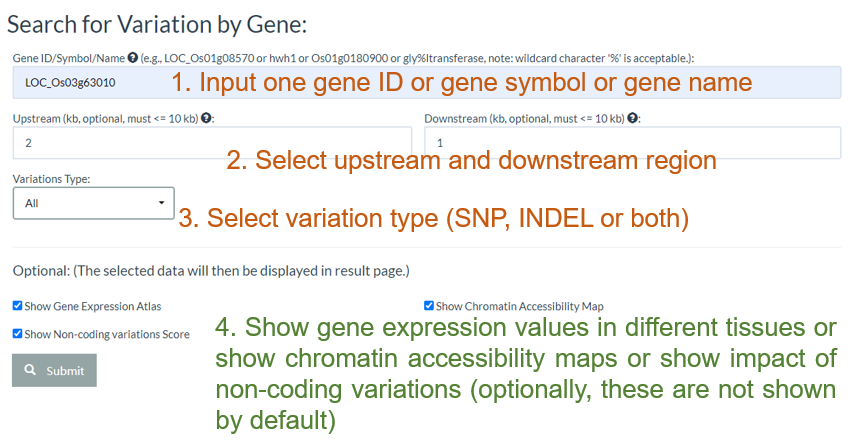
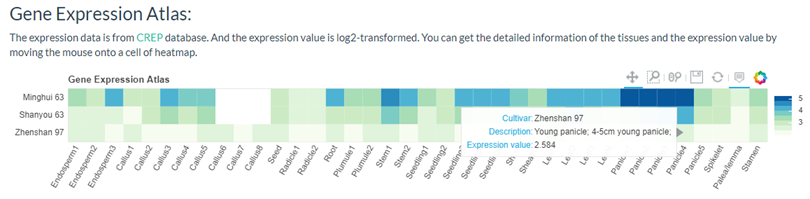
You can get a gene expression heatmap if selected 'Show Gene Expression Atlas'.
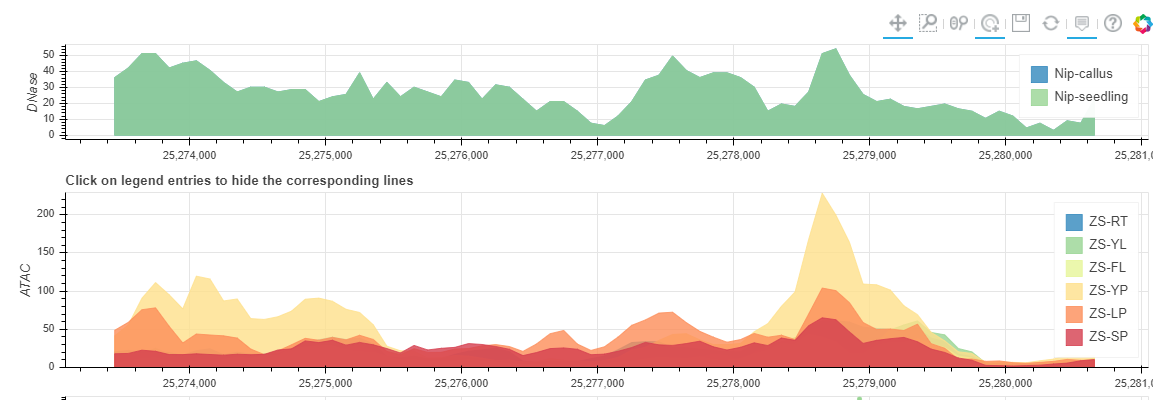
You can get a Chromatin Accessibility Map if selected 'Show Chromatin Accessibility Map'. And you can click the legend entries to hide some tissues.
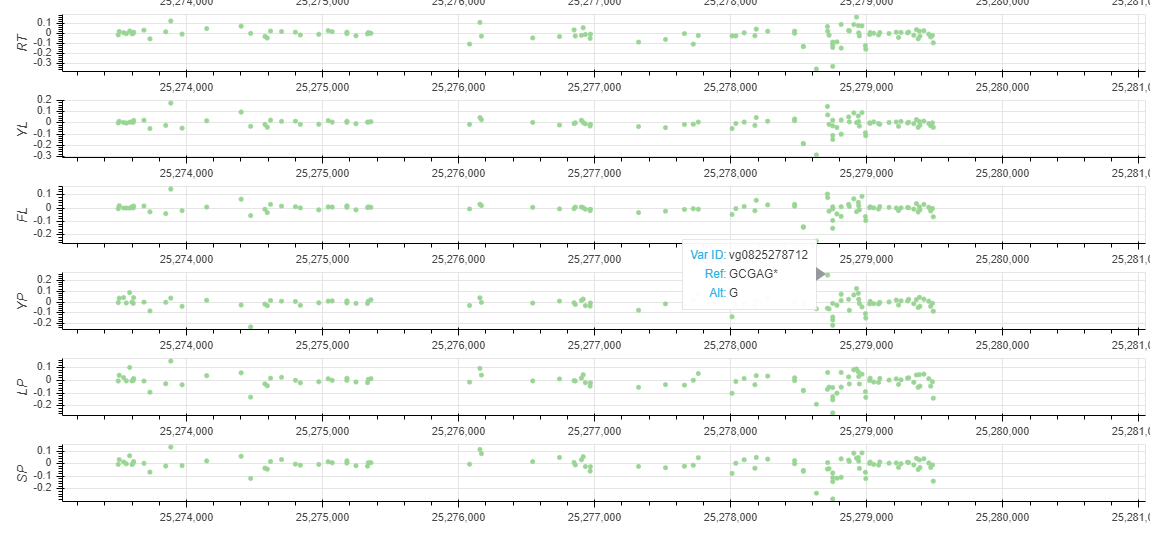
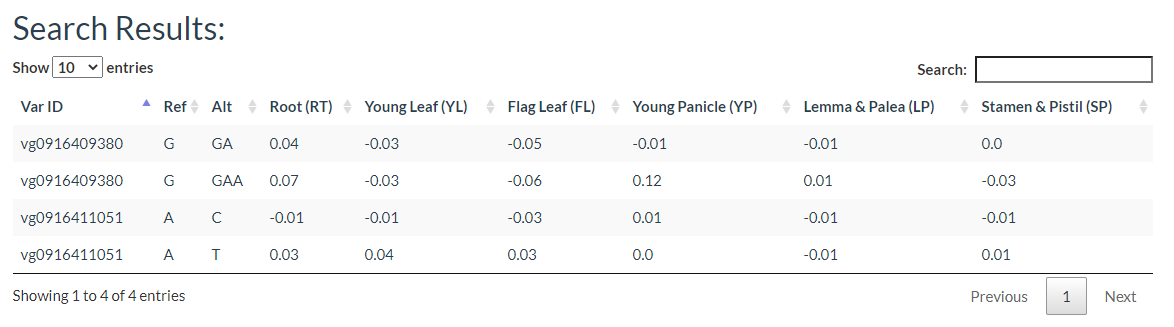
You can get a Non-coding Varation Scores Map if selected 'Show Non-coding variations Score'. root (RT), young leaf (YL), flag leaf (FL), young panicle (YP), lemma & palea (LP), and stamen & pistil (SP). In this region, the more extreme the score, the more likely it is to regulate chromatin opening around the variation.
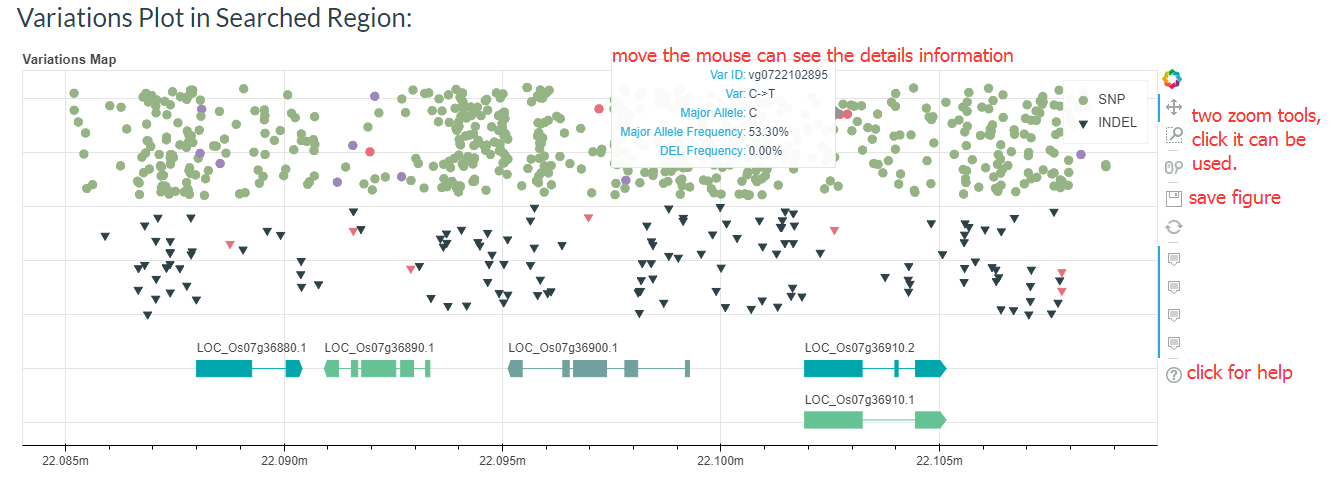
You can also find the regional variant map. You can click on the points in the map to go to the detailed variation information page.
And the results table is also can be sorted and searched.
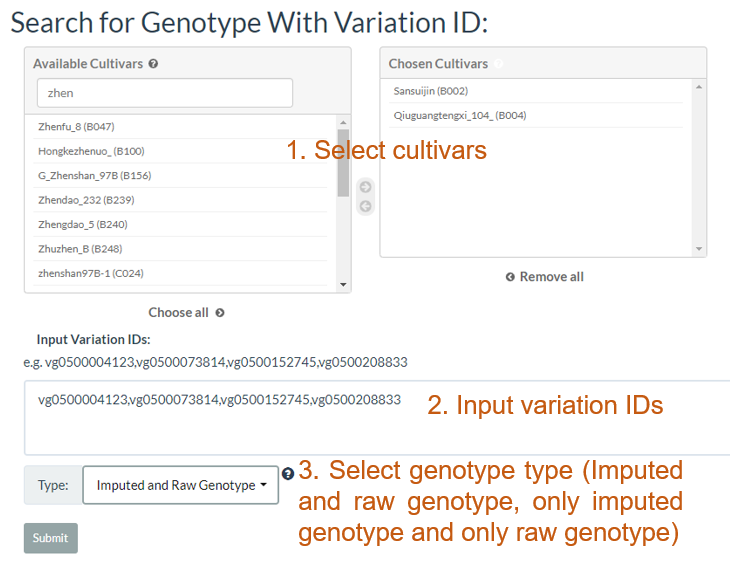
3. How to search genotype with variation ID? top
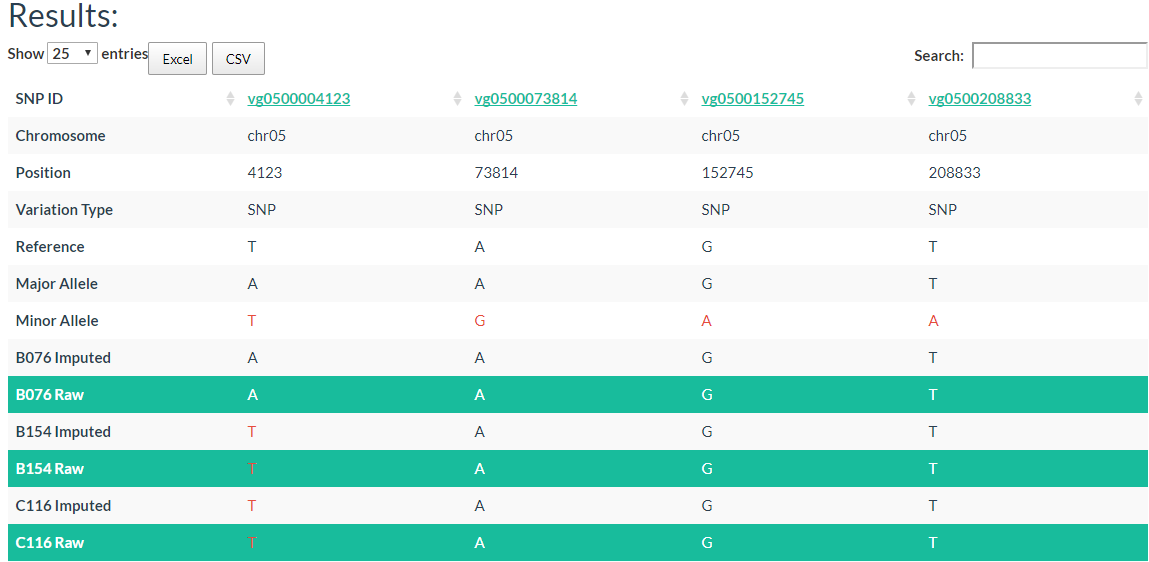
In the table, each column represents one variant. The table contains chromosome, locus, variant type (SNP/INDEL), reference allele, major allele, and minor allele information. An allele in red indicates a minor allele, and a background color in green indicates a raw genotype (not imputed).
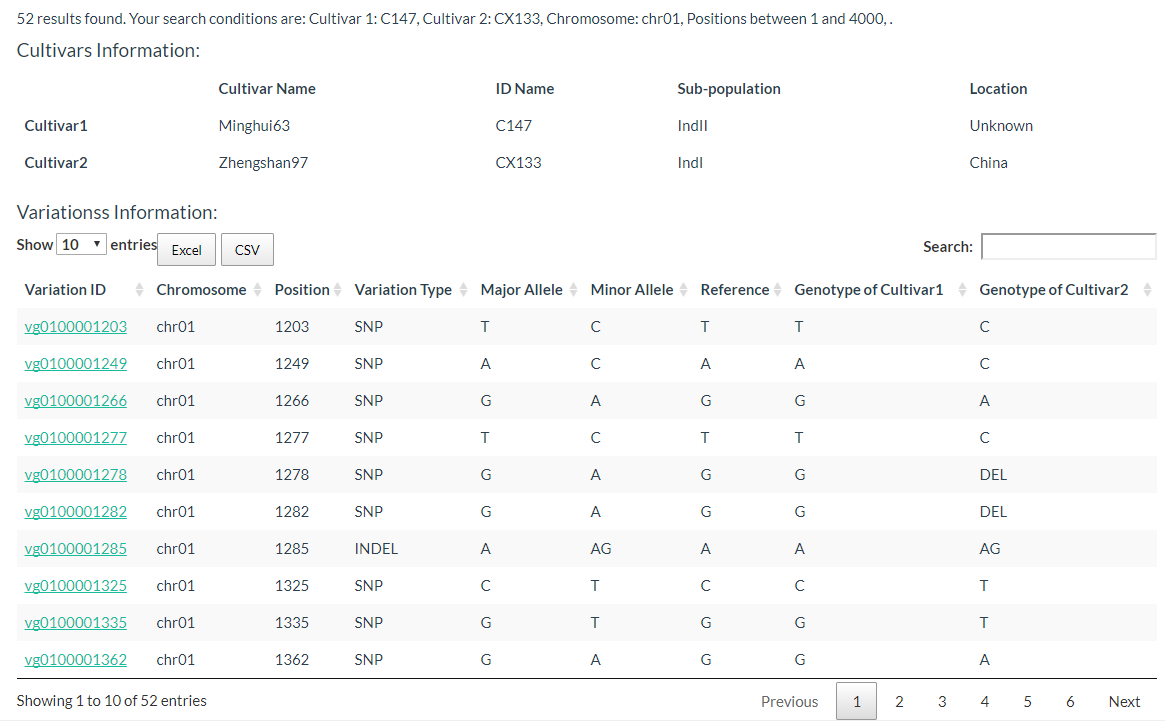
4. How to search for polymorphic positions between two cultivars? top
By entering keywords, you can search for cultivars and reduce selection time. The detailed steps are shown in the figure below.
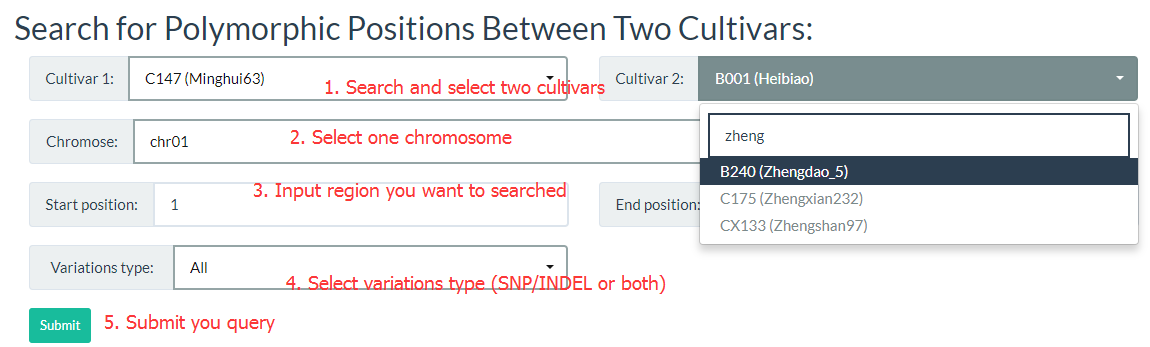
The results are presented in two tables, the first table include cultivar information, which includes cultivar name, ID name in the database, subpopulation information, and location information. The second table contains the genotypes of the two selected cultivars.
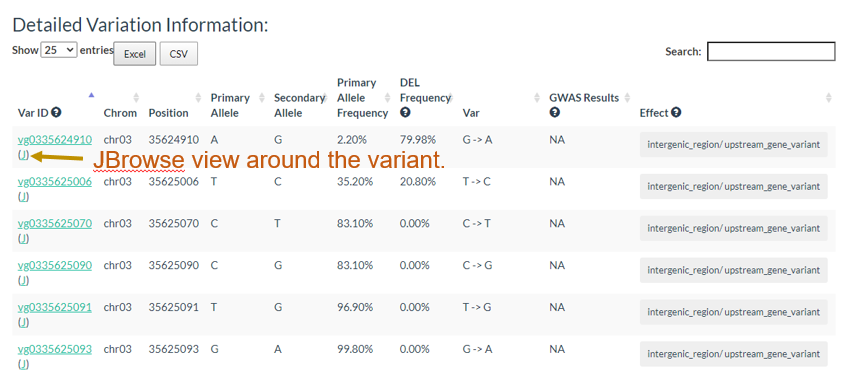
5. How to search for variation information with variation ID? top
In this link, you just need to enter one variation ID to get the result.
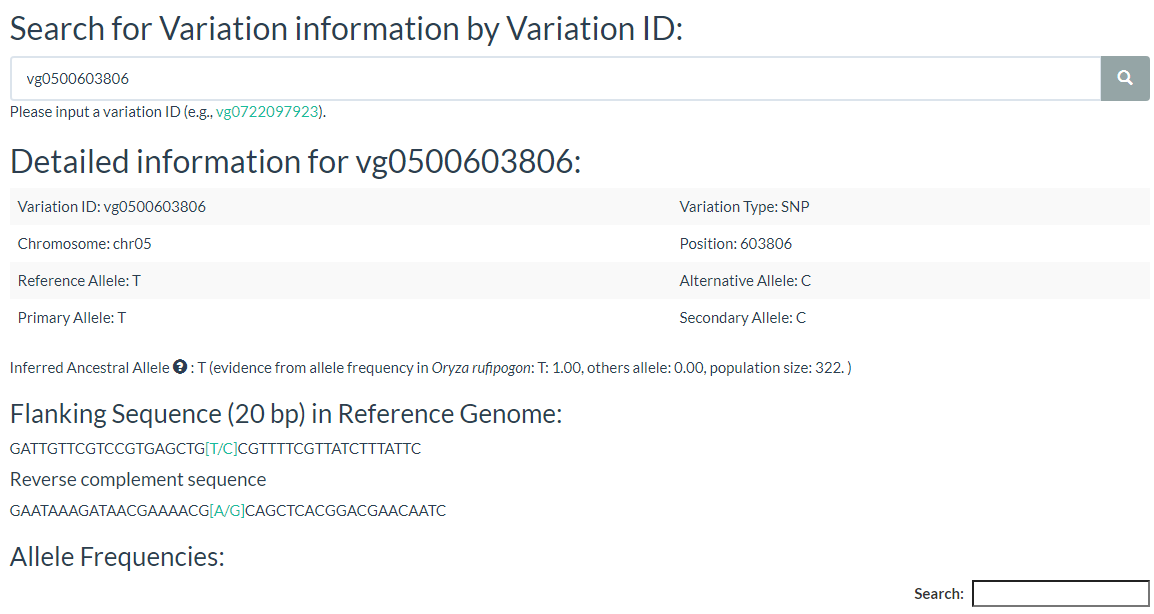
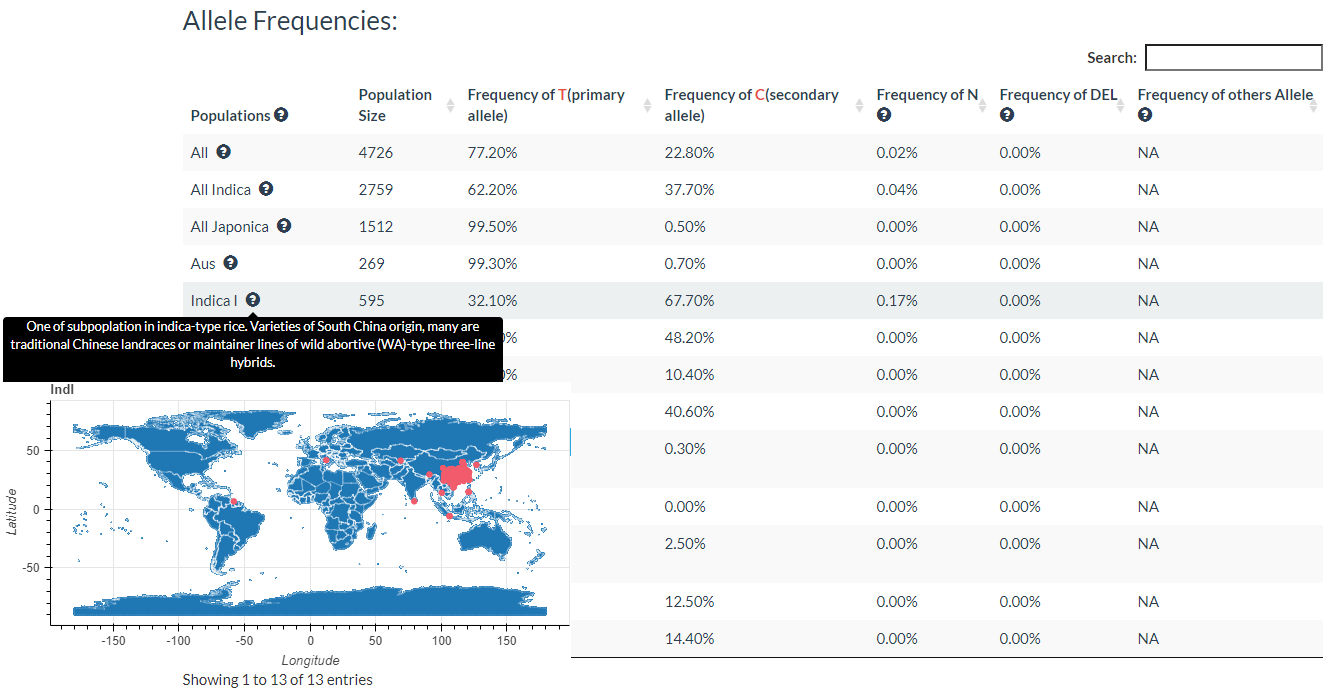
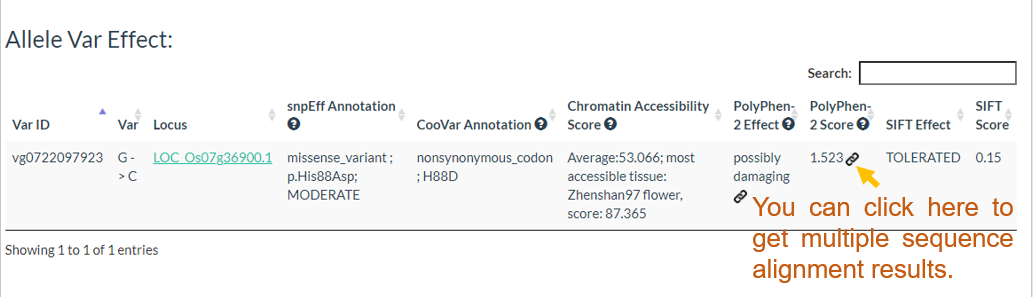
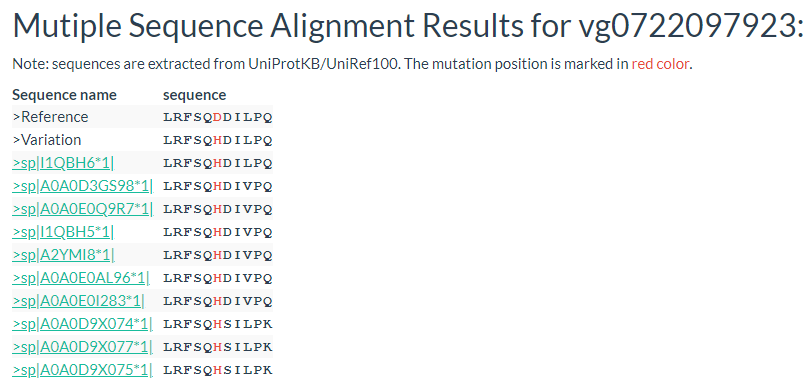
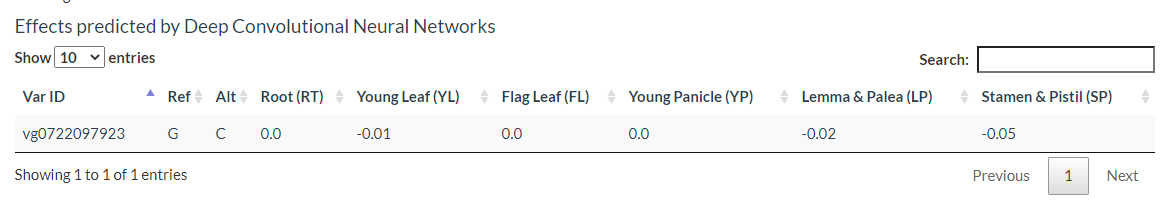
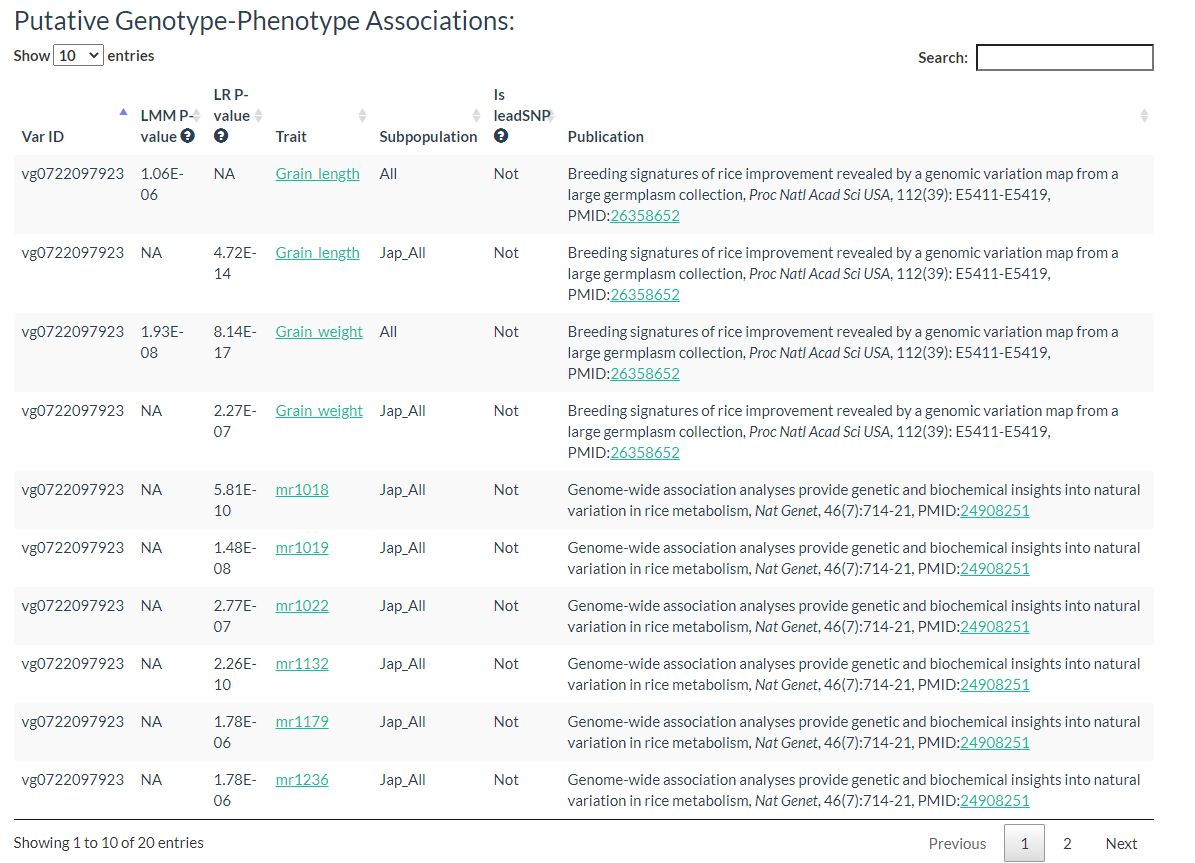
Results include flanking sequence (20 bp) around the variation, allele frequencies for each population, predicted effects of the variation, and GWAS results for the variation.
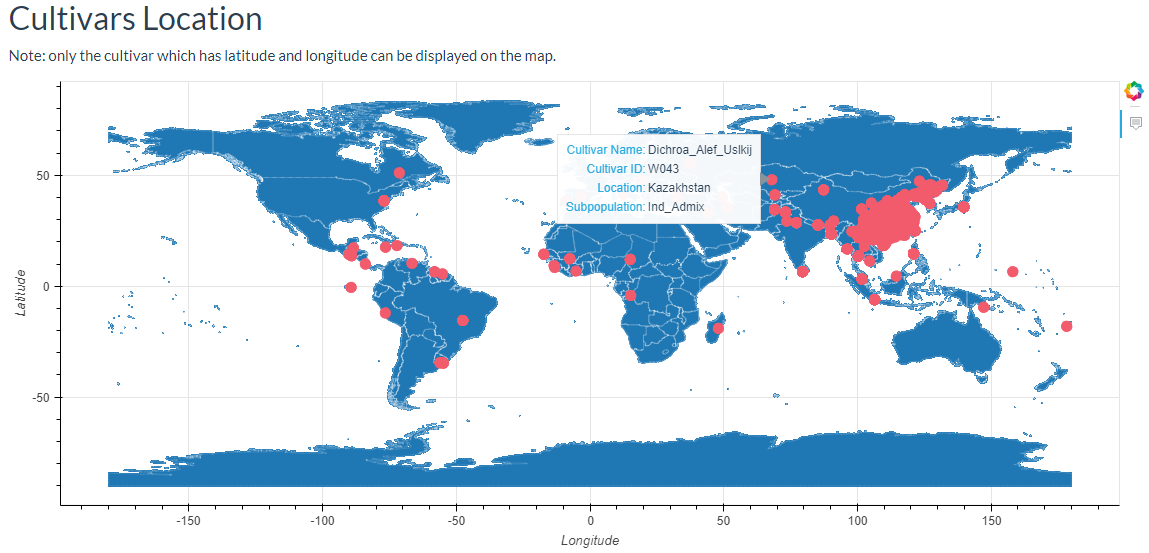
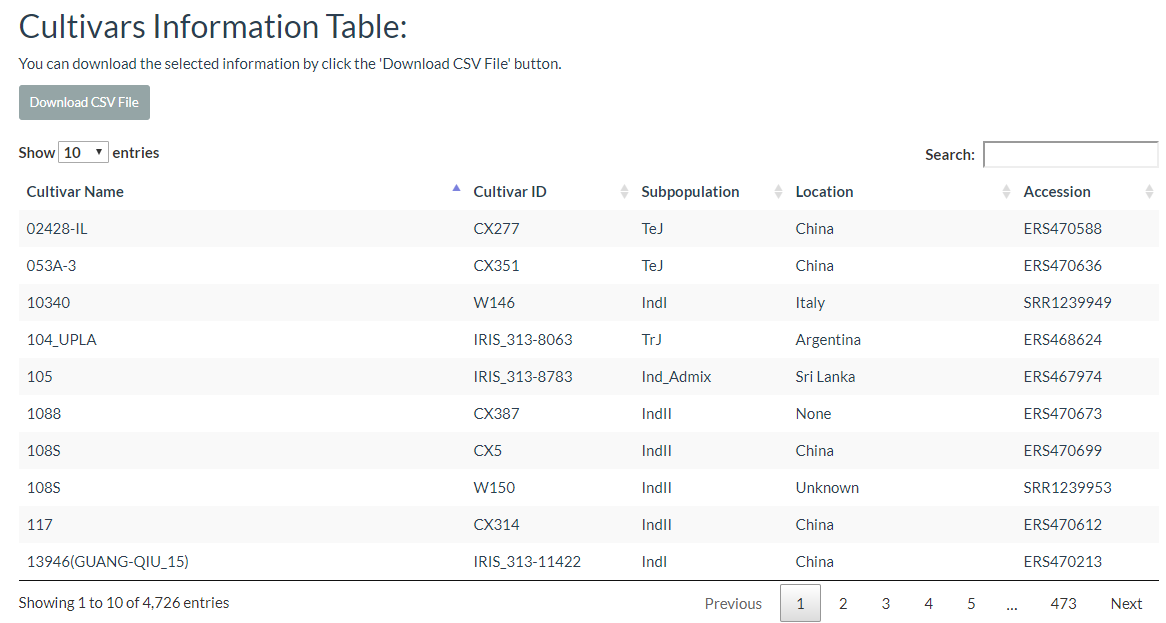
6. How to search cultivar information? top
In this link, cultivars can be selected and the results will output the cultivars location image and the detailed information table.
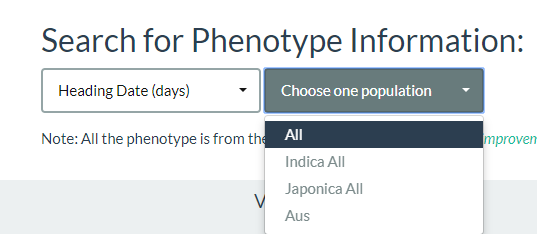
7. How to search phenotype information? top
By using this link, first, you should select one phenotype name, and then choose one population. Up to now, we collected 13 agronomic traits (including heading date, plant height, and grain weight et al.) and 840 metabolite traits (Xie et al., 2015, Proc Natl Acad Sci USA, 112: E5411-E5419; Chen et al., 2014, Nat Genet, 46:714-721).
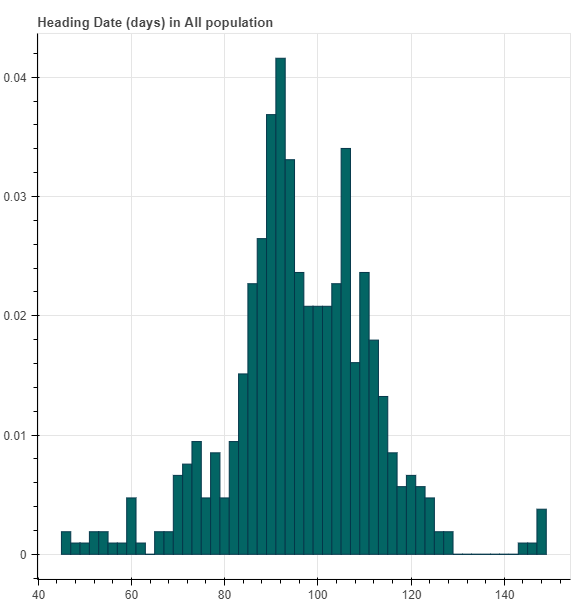
For each phenotype, we first draw a histogram of the phenotype distribution.
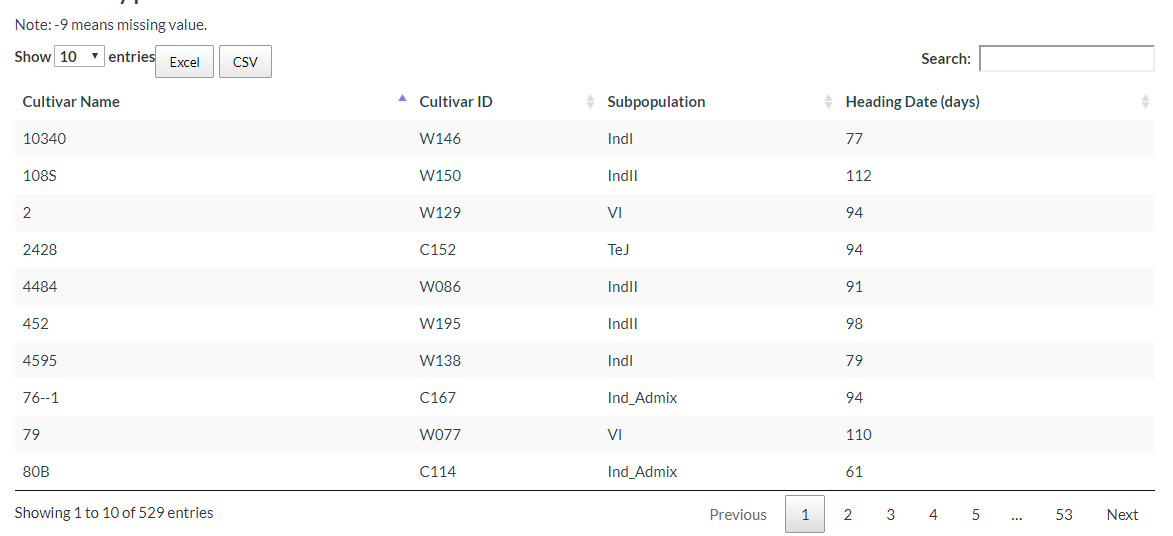
Phenotype information sheets for each cultivar are also available for download.
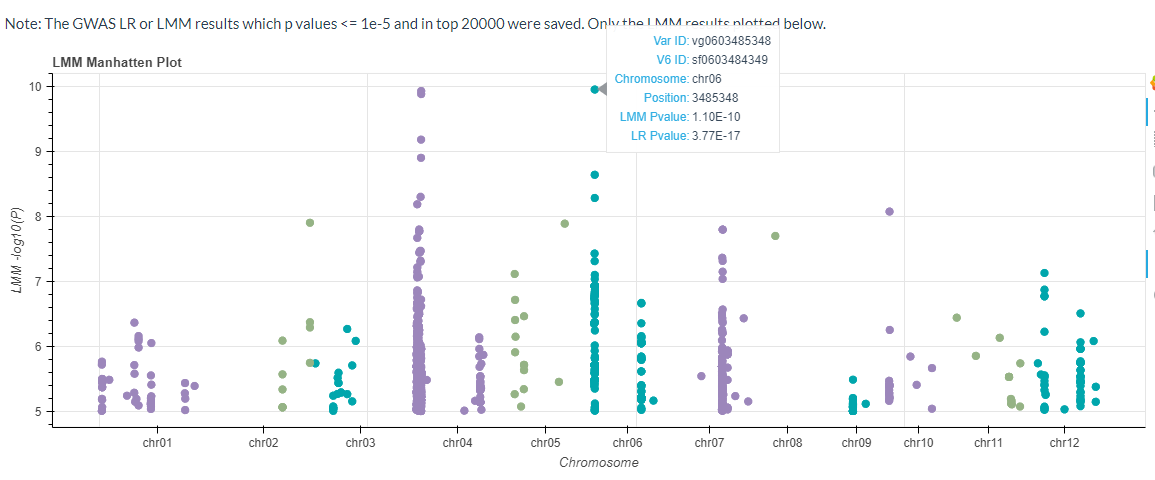
The GWAS results for the mixed linear model will also be plotted (p-values <= 1e-5 or p-values ranked in the top 20,000).
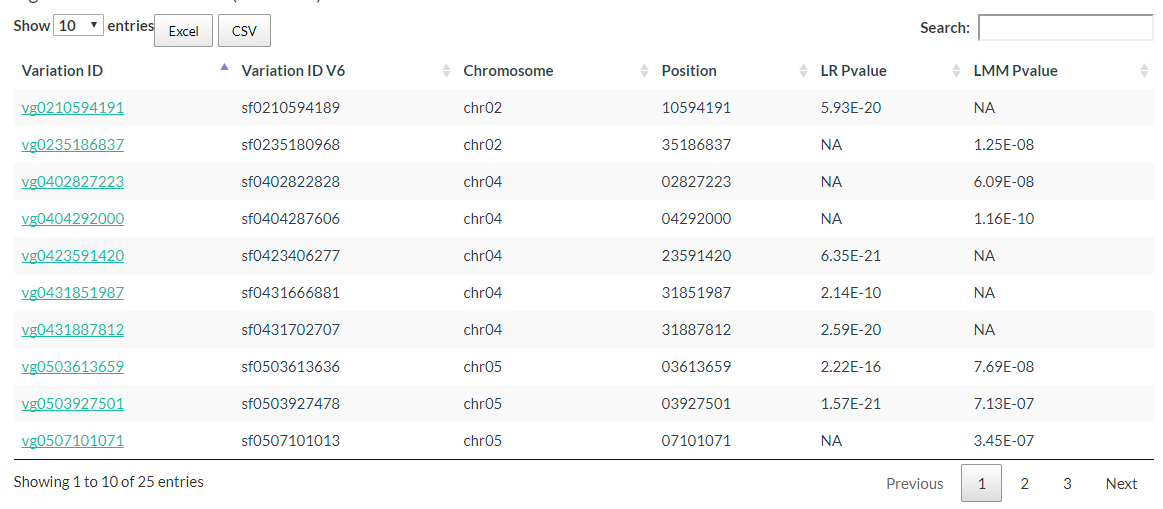
The Significant Candidate Loci information can also be downloaded.
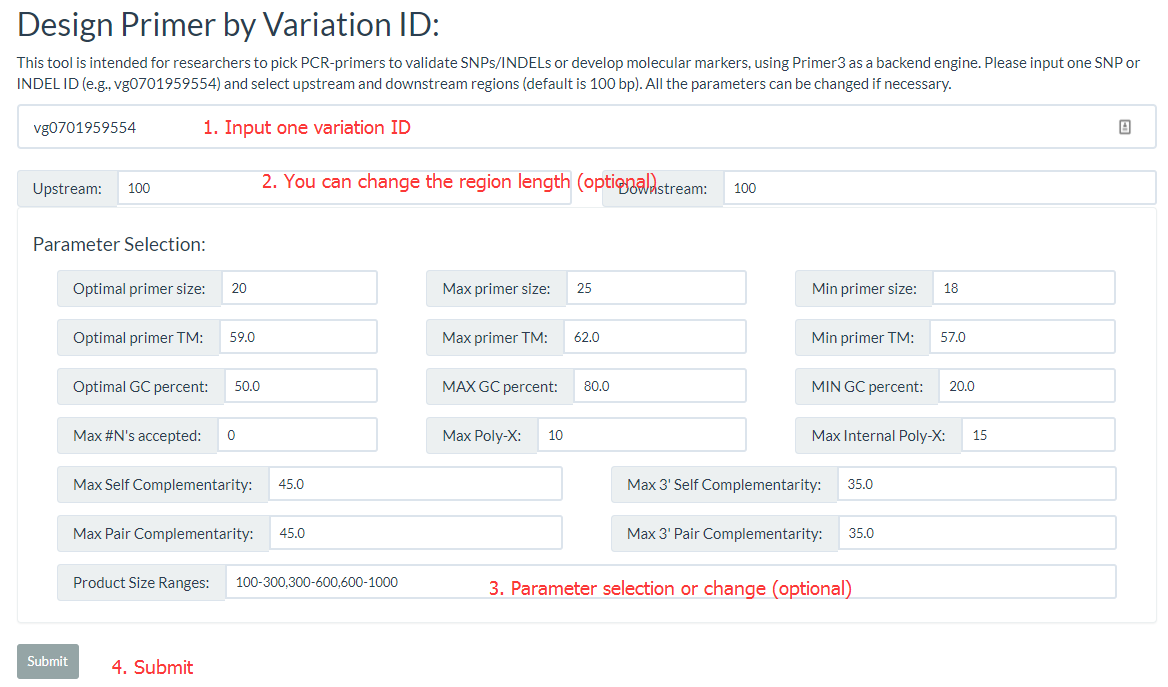
8. How to design primer by using RiceVarMap? top
The 'Design Primer by Variation ID' is designed to allow researchers to select PCR-primers to validate SNPs/INDELs or develop molecular markers. The 'Design Primer by Region' is designed to allow researchers to select PCR-primers to amplify genomic regions to avoid overlap with known SNPs/INDELs. They all use Primer3 as a backend engine.
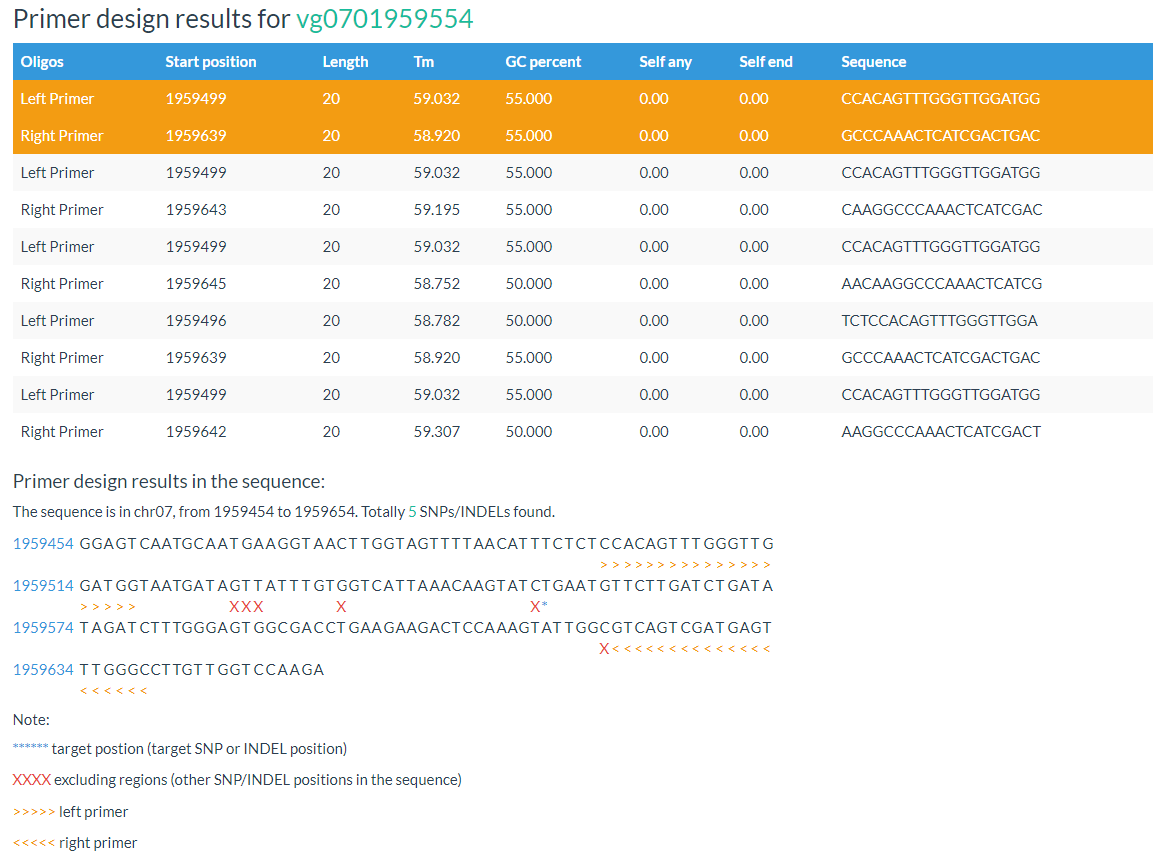
Both primer positions and variation positions are indicated in the results.
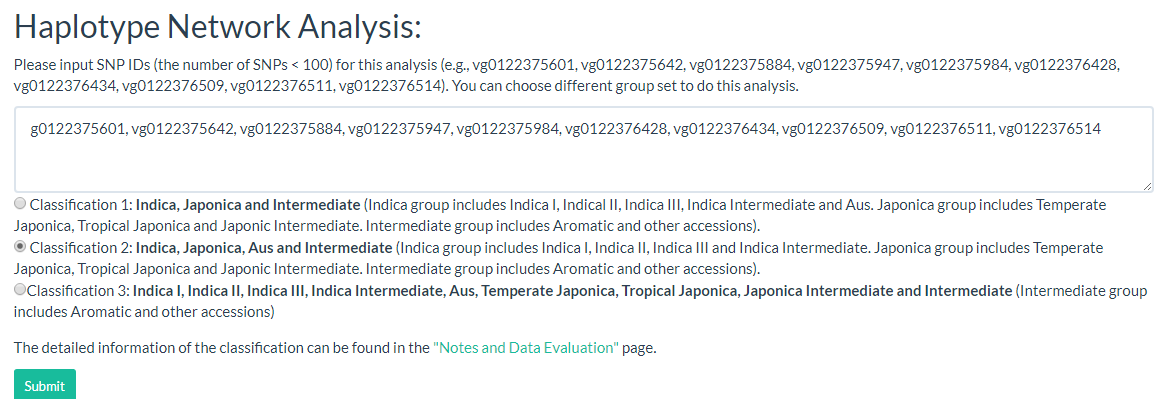
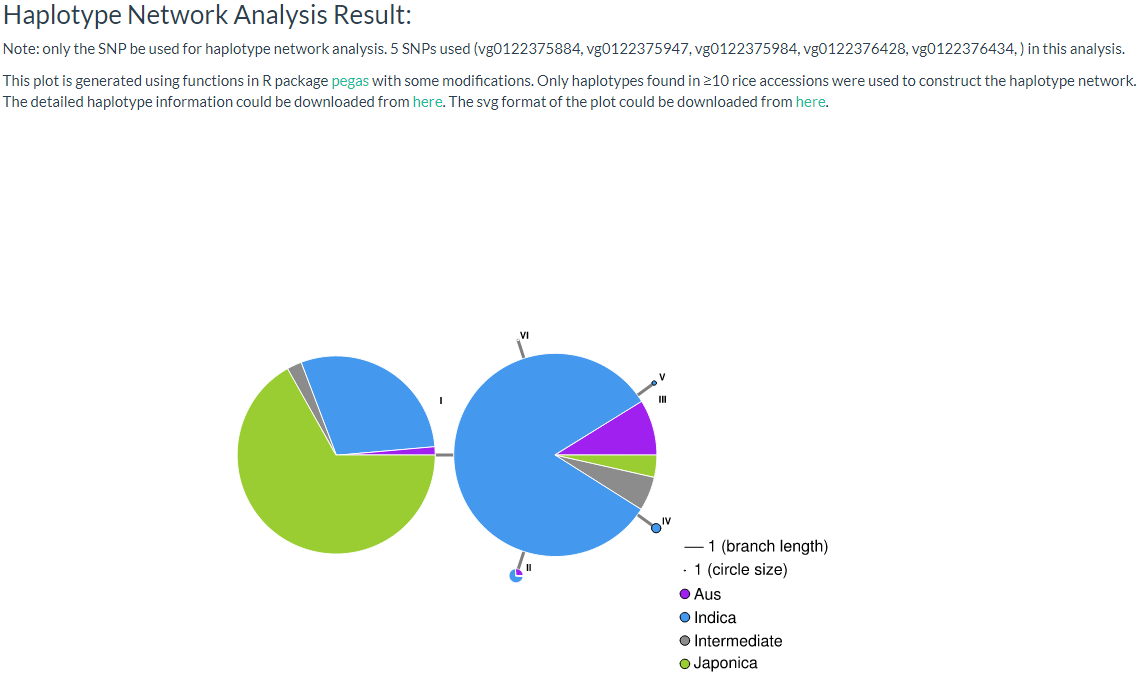
9. How to do haplotype network analysis? top
Haplotype networks are frequently used for population genetic analysis, and in this page we can enter the selected variant ID (must be SNP, INDEL will be filtered out) and select a population category for haplotype analysis. The user can download CSV and SVG files for further analysis (the page link).
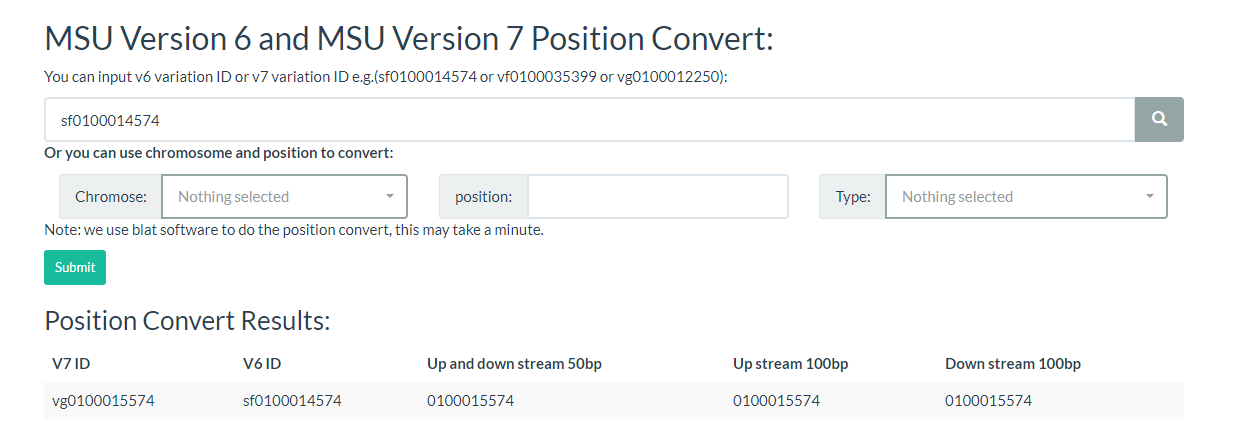
10. How to convert IDs / coordinates across reference genomes? top
RiceVarMap3 supports coordinate/ID conversion across multiple rice reference genomes (e.g., NIP / MH63 / ZS97). On the conversion page, you can enter a variant ID or a chromosome location to convert the locus to homologous positions in other references (if available).
11. Updated variant resources and annotations in RiceVarMap3 top
RiceVarMap3 significantly expands both data resources and annotation layers. The database integrates variation datasets from multiple representative reference genomes (e.g., Nipponbare/NIP as a japonica reference, MingHui63/MH63 and ZhenShan97B/ZS97 as indica references), enabling cross-reference exploration and analysis.
RiceVarMap3 also updates functional annotation workflows. In addition to classical consequence annotation (e.g., gene model–based consequence categories), RiceVarMap3 integrates updated pipelines for coding consequence prediction and protein impact estimation, and provides standardized outputs aligned to the selected gene annotation versions (e.g., RAP-based annotations where applicable).
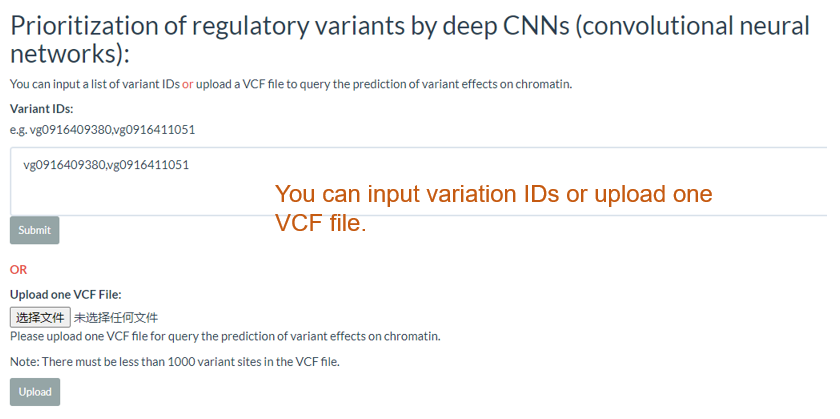
12. Deep-learning–based regulatory variant prioritization top
To interpret noncoding variation, RiceVarMap3 integrates deep-learning models trained on multi-tissue chromatin accessibility profiles across cultivars. These models estimate the direction and magnitude of regulatory effects for candidate variants and help prioritize high-impact regulatory variants.
You can typically input a list of variant IDs or upload a VCF file to query predictions on chromatin accessibility or other configured regulatory tracks. Results include tissue-specific effect scores, interactive accessibility profiles, and local gene model context to support mechanistic interpretation.

13. Population differentiation analysis top
RiceVarMap3 provides population genetics modules for investigating population differentiation and potential selection signals. Users can select populations/subgroups and genomic windows to compute and visualize statistics such as FST and nucleotide diversity (π), and to compare differentiation patterns between population pairs.
This module is particularly useful when combined with functional annotations and regulatory variant prioritization results, enabling population-aware interpretation of candidate loci and variants.
14. RAG-based intelligent natural language query top
RiceVarMap3 introduces an intelligent natural language interface powered by retrieval-augmented generation (RAG). The assistant parses user input, classifies the intent (e.g., region search, gene query, population analysis, regulatory scoring), extracts parameters (gene IDs, coordinates, populations, thresholds), and routes the request to the corresponding functional pages.
In addition, the assistant can provide concise explanations of outputs and suggest follow-up analysis steps based on the built-in knowledge base and the current query context.
Updated: 2026/02/27