What's New
2024-02-02
On the 'Search for Variation information by Variation ID' page, users can directly access the cultivation information corresponding to each genotype through the links in the table.
2023-01-31
Fixed the error that less than 4 results could not be returned properly when designing primers. Thanks the users reported this bug.
2022-12-09
Bug fixed: Fixed the problem that some gene IDs could not be queried in the database. Thanks Dr. Haifu Tu reported this bug.
Navigation
Tutorial of RiceVarMap v2.0
Search for Variations by Gene
GWAS Results Search
Regional Variations Search
Search for Genotype With Variation ID
Search for Variation information by Variation ID
Search for Polymorphic Positions Between Two Culti
Search for Cultivar Information
Design Primer by Variation ID
Search for Phenotype Information
Design Primer by Region
Regulatory Variant Prioritization
Haplotype Network Analysis
Variation Coordinate Converter
Published researches based on data of RiceVarMap
Notes and Data Evaluation
Welcome to Rice Variation Map v2.0!
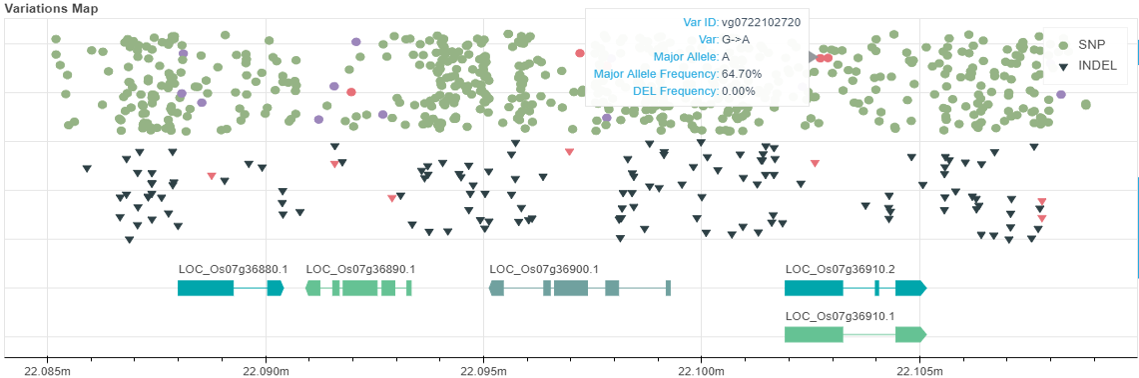
RiceVarMap v2.0 is a comprehensive database for rice genomic variation and its functional annotation. It provides curated information of 17,397,026 genomic variations (including 14,541,446 SNPs and 2,855,580 small INDELs ) from sequencing data of 4,726 rice accessions. These variations were identified using GATK software based on the assembly Os-Nipponbare-Reference-IRGSP-1.0. (Note: you can still access to RiceVarMap v1.0 for querying variations based on the old assembly Nipponbare MSU v6.1).
Features
High quality and complete genotype data. The genotypes of all accessions were imputed and evaluated, resulting in an overall missing data rate of <3% and an estimated accuracy greater than 99%. The SNP/INDEL genotypes of all accessions are available for online queries and download. To facilitate population genetic analysis, RiceVarMap also offers ancestral allele information and allele distribution data of subpopulations.
Comprehensive annotations of genomic variations. RiceVarMap now provides more precise variations and annotations. Haplotype-based approaches and conservatism of a segment in species were used to evaluate the impact of missense variations. To understanding the impact of variation located in the noncoding regions, we quantified genome-wide chromatin accessibility, which indicate the binding sites and the binding intensites of transcription factors. Based on these high-quality data, we then used Basenji (Kelley et al., 2018), a deep learning method to train the effect of nucleotide sequence on changes in chromatin openness. Thirdly, we used variant sites identified in rice populations and trained model to predict the variant effect in different tissues.
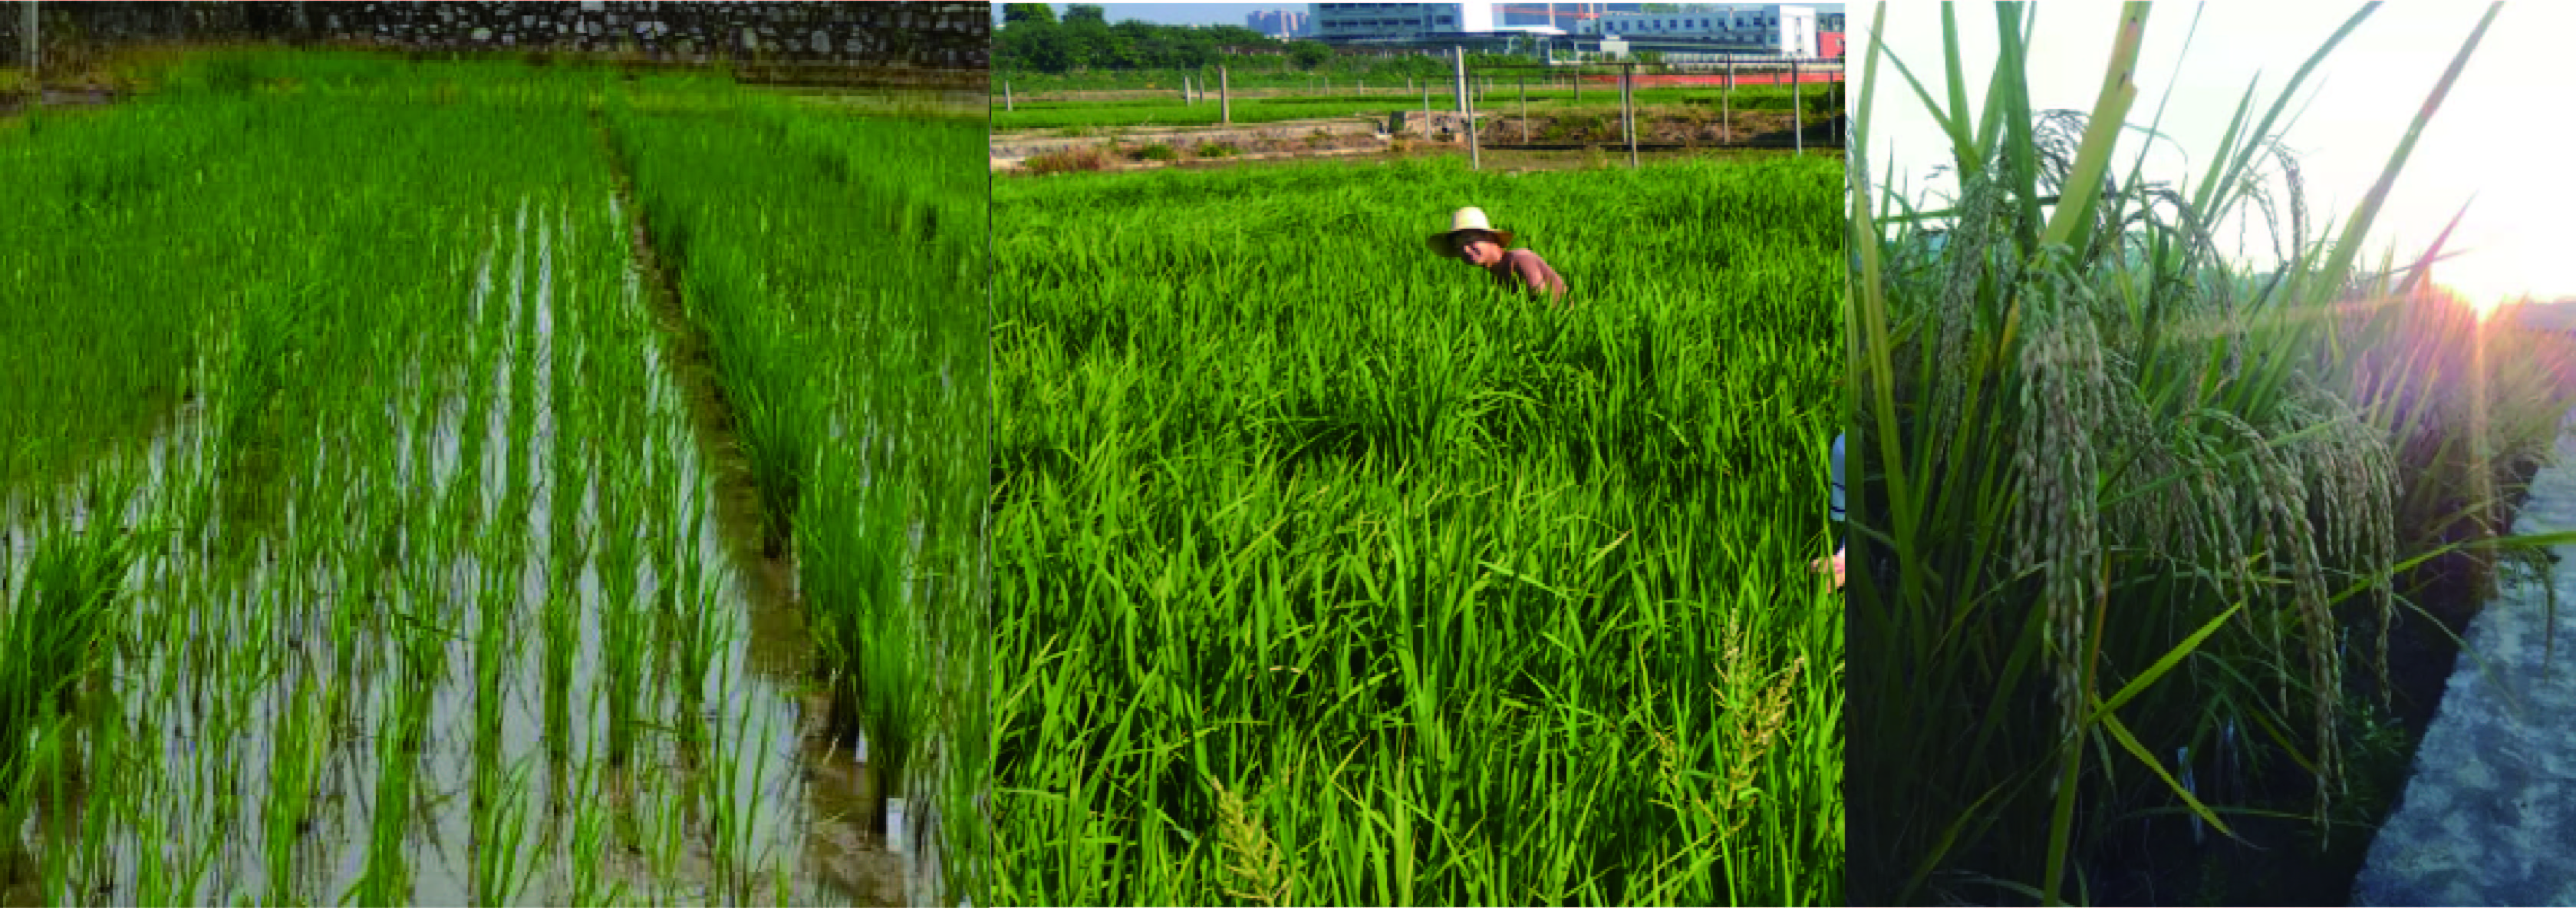
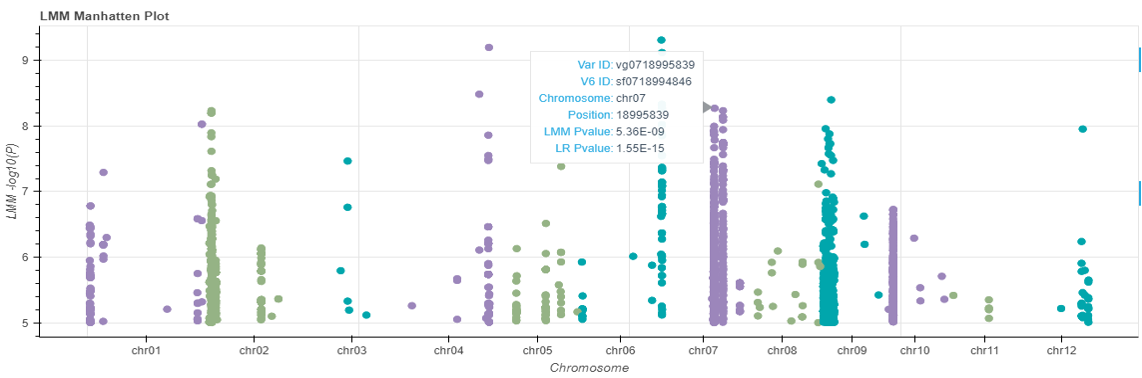
Phenotype data and GWAS results. The database provides geographical details and phenotype images, agronomic and metabolic traits for some rice accessions. Plant scientists and breeders can also search for significant SNPs associated with various traits to develop useful molecular markers or pick up candidate genes.
New query methods and more tools. Besides all functions offered by RiceVarMap v1.0, we have designed more powerful visualization tools based on bokeh and JBrowse. Specifically, for non-coding variation, we provide an online prediction tool, Regulatory Variant Prioritization, users can query the effect of variants online by submitting variant IDs in the database or a VCF file.
Data Source
Genotype data
Currently, we collected sequencing data from three sets of rice germplasms consisting of totally 4,726 accessions of cultivated rice (Oryza sativa L.):
The first set of germplasm consisted of 533 accessions selected to represent both the usefulness in rice improvement and the genetic diversity in the cultivated species. We sequenced the 533 accessions using the Illumina HiSeq 2000 in the form of 90-bp paired-end reads to generate high-quality sequences of more than one gigabase per accession (>2.5x per genome, total 6.7 billion reads). These raw data is available in NCBI with BioProject accession number PRJNA171289. We provide phenotype images, agronomic and metabolic traits for these accessions.
The second set of germplasm was 950 rice accessions sequenced by Huang et al. (2012, Nat Genet, 44:32-39) that were downloaded from the EBI European Nucleotide Archive (accession number ERP000106 and ERP000729), which consists of 4.6 billion 73-bp paired-end reads (~1x per genome).
The third set of germplasm was 3024 rice accessions from The 3,000 Rice Genomes Project (2014, GigaScience, 3:7) that were downloaded from the EBI European Nucleotide Archive (accession number PRJEB6180), and unpublished resequencing data from 219 rice accessions, which has an average sequencing depth of 14x per genome.
Phenotype data and GWAS results
RiceVarMap currently provides phenotypic data and GWAS results for 13 agronomic traits (including heading date, plant height, and grain weight et al.) and 840 metabolite traits (Xie et al., 2015, Proc Natl Acad Sci USA, 112: E5411-E5419; Chen et al., 2014, Nat Genet, 46:714-721). Phenotype information is available on this page.
Chromatin accessibility data
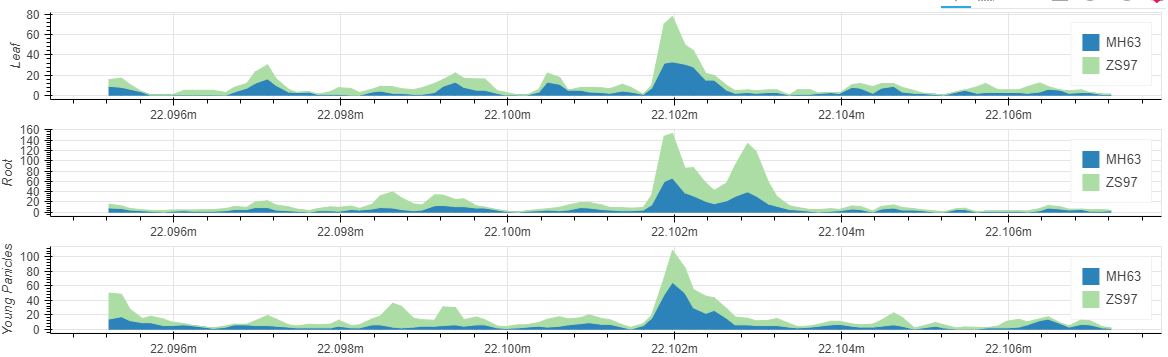
We collected six tissues (root (RT), young leaf (YL), flag leaf (FL), young panicle (YP), lemma & palea (LP), and stamen & pistil (SP)) of Zhenshan 97 (an indica/xian variety) for ATAC-seq experiment, with at least two replicates of each tissue. After mapped to the reference genome, an average of 39.9 million qualified fragments were obtained per sample.
Comments or Questions
For any questions please contact Hu Zhao (zhaohu [at] mail.hzau.edu.cn).
Recommended browsers
The recommended browsers are Chrome, Firefox, Safari, and Edge ( IE8 and earlier have poorer support and may give a lesser experience).
Citations
Researchers who wish to use RiceVarMap are encouraged to refer to our publication or more:
Zhao H, Li J, Yang L, Qin G, Xia C, Xu X, Su Y, Liu Y, Ming L, Chen L-L, Xiong L and Xie W. An inferred functional impact map of genetic variants in rice. Molecular Plant. 2021, 14: 1584–1599
Zhao H, Yao W, Ouyang Y, Yang W, Wang G, Lian X, Xing Y, Chen L and Xie W. RiceVarMap: a comprehensive database of rice genomic variations. Nucleic Acids Research. 2015, 43(D1): D1018-D1022