Tutorial of RiceVarMap v2.0
- 1. How to search for variations by region?
- 2. How to search for variations in a gene?
- 3. How to search genotype with variation ID?
- 4. How to search for polymorphic positions between two cultivars?
- 5. How to search for variation information with variation ID?
- 6. How to search cultivar information?
- 7. How to search phenotype information?
- 8. How to design primer by using RiceVarMap?
- 9. How to do haplotype network analysis?
- 10. How to convert RiceVarMap v1 ID to v2 ID (or v2 ID to V1 ID)?
- 11. Prioritization of regulatory variants by deep CNNs
- 12. How to search QTN information in RiceNavi?
RiceVarMap is a database that contains 17,397,026 variations (including 14,541,446 SNPs and 2,855,580 small INDELs ) of 4,726 cultivars all over the world.
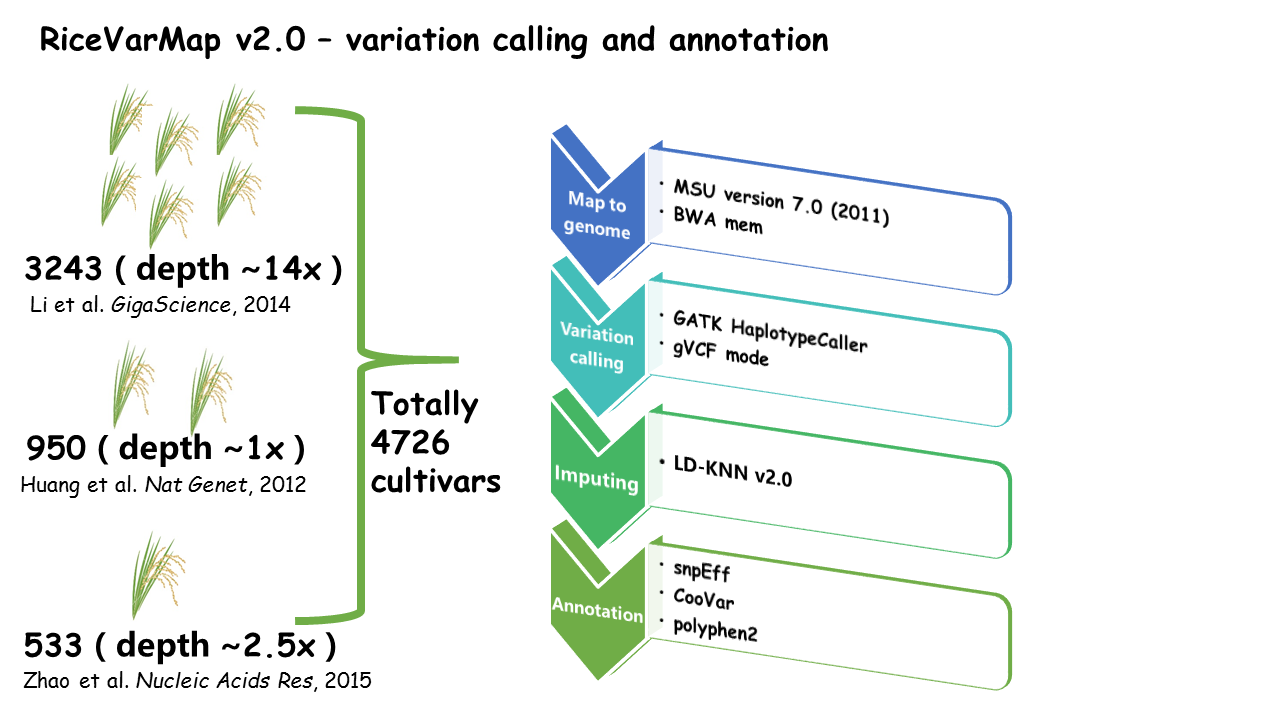
The database provides a variety of variation query functions (e.g., 'Search for Variation by Region', 'Search for Variation in Gene' and 'Search for Genotype With Variation ID' ) and many useful analysis tools (e.g., 'Prioritization of regulatory variants by deep CNNs', 'Design Primer by Region', 'Design Primer by Variation ID' and 'Haplotype Network Analysis').
Haplotype-based approaches and conservatism of a segment in species were used to evaluate the impact of missense variations. To understanding the impact of variation located in the noncoding regions, we quantified genome-wide chromatin accessibility, which indicate the binding sites and the binding intensites of transcription factors. Based on these high-quality data, we then used Basenji (Kelley et al., 2018), a deep learning method to train the effect of nucleotide sequence on changes in chromatin openness. Thirdly, we used variant sites identified in rice populations and trained model to predict the variant effect in different tissues.
You can visit this version of RiceVarMap by entering its address http://ricevarmap.ncpgr.cn. Background of data collection, processing and evaluation could be found in Notes and Data Evaluation page.
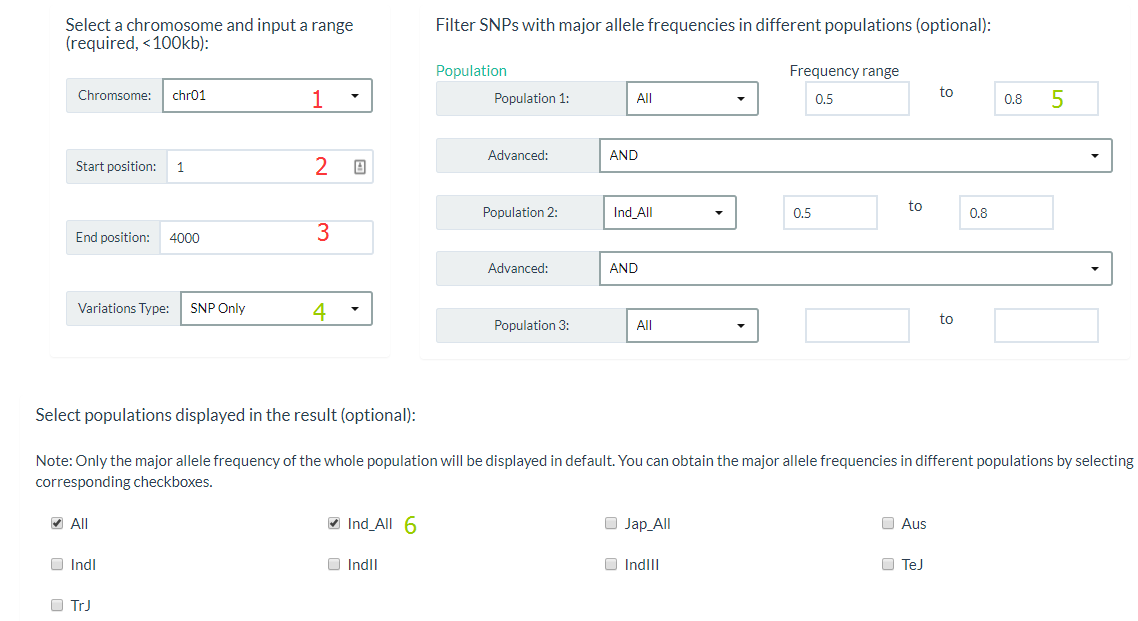
1. How to search for variations by region? top
You can click this link, specify a chromosome and input a range (required), and also you can filter Variations by major allele frequencies (optional). For results display, you can select only output SNP or INDEL and populations major allele frequencies in this region.
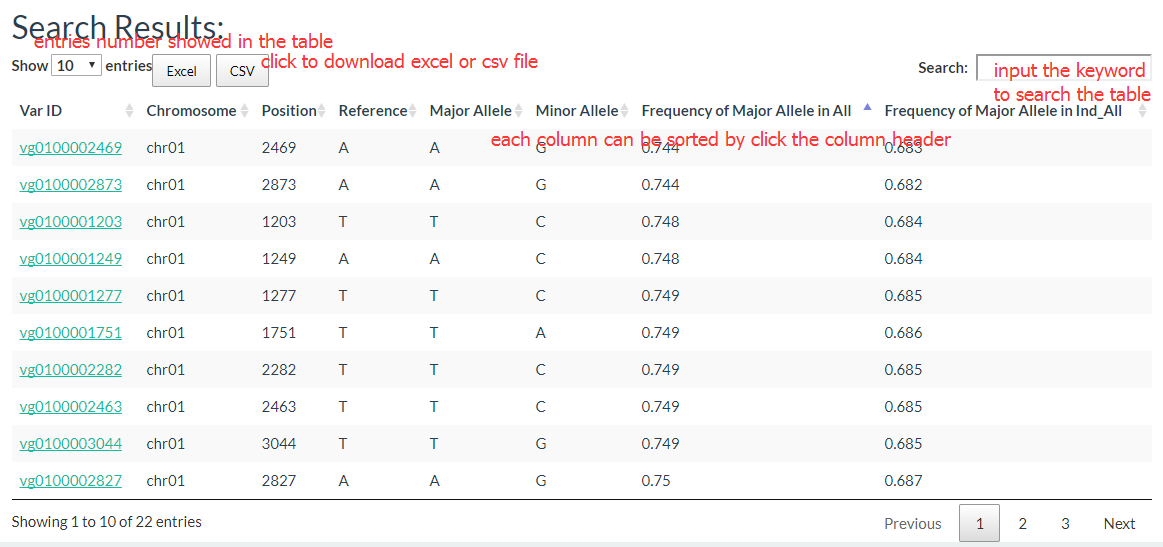
The results show like this:
2. How to search for variations in a gene? top
You can click this link, and enter one gene Loci or gene symbol (e.g. LOC_Os01g01070), and to search for variation in upstream or downstream regions, enter the distance upstream or downstream of the gene (e.g., 0.5 kb upstream, 0.2 kb downstream, optional).
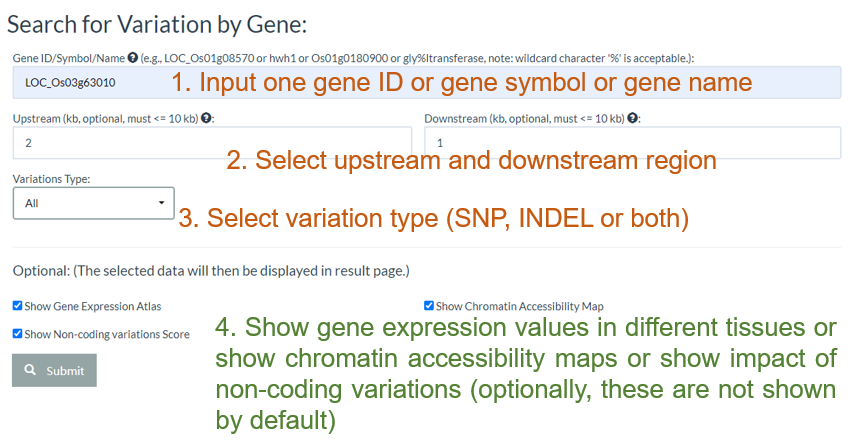
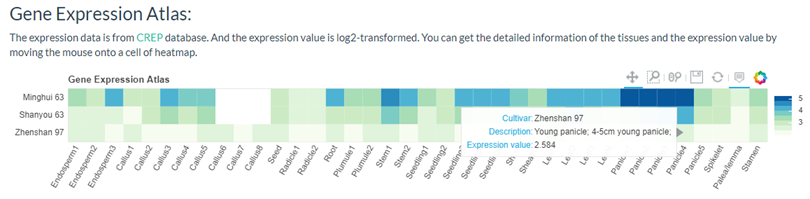
You can get a gene expression heatmap if selected 'Show Gene Expression Atlas'.
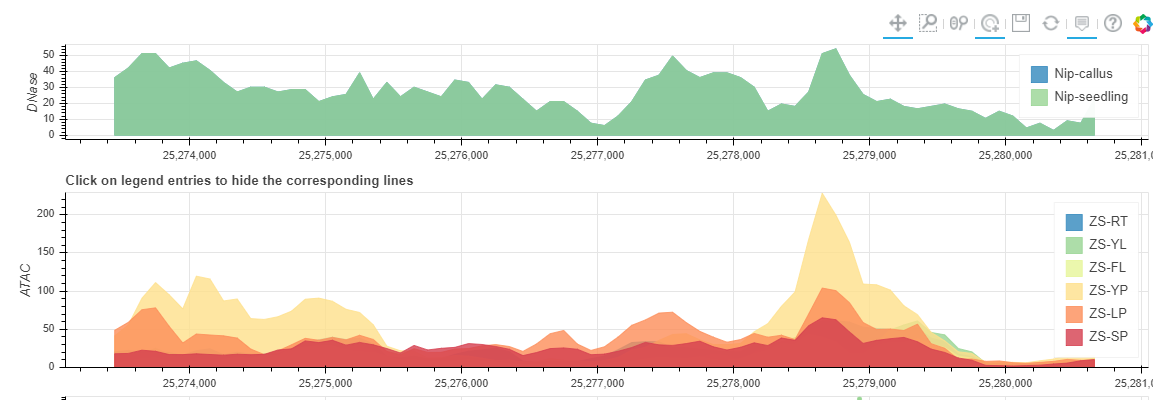
You can get a Chromatin Accessibility Map if selected 'Show Chromatin Accessibility Map'. And you can click the legend entries to hide some tissues.
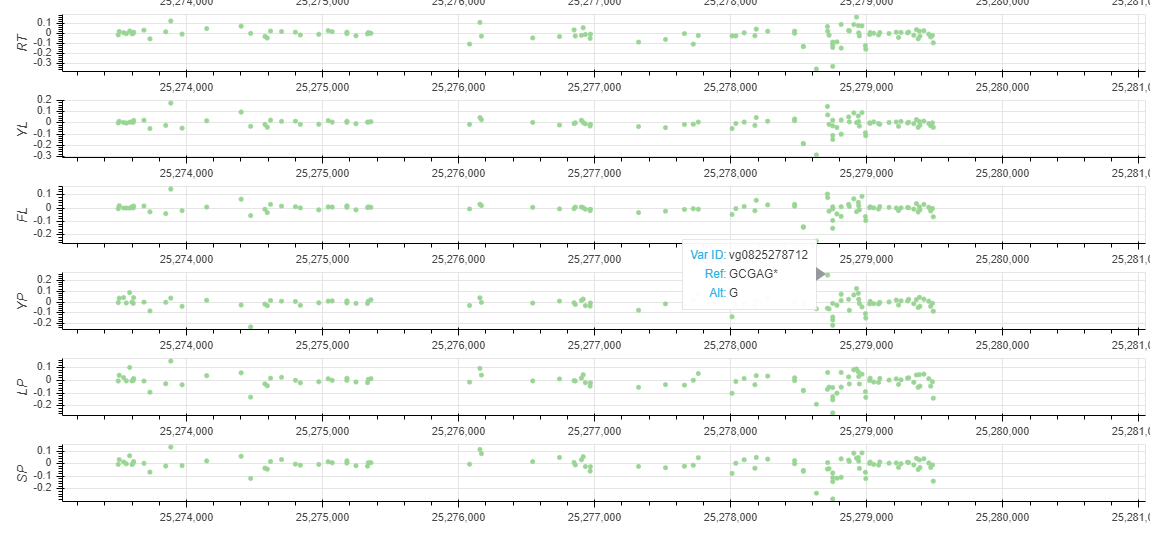
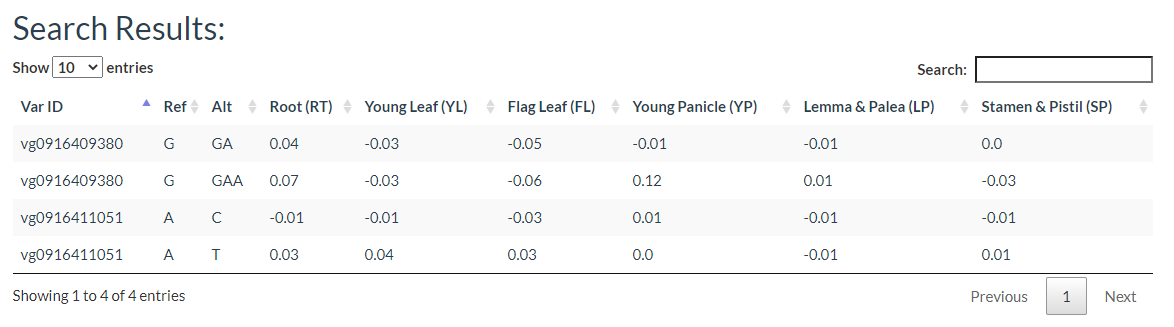
You can get a Non-coding Varation Scores Map if selected 'Show Non-coding variations Score'. root (RT), young leaf (YL), flag leaf (FL), young panicle (YP), lemma & palea (LP), and stamen & pistil (SP). In this region, the more extreme the score, the more likely it is to regulate chromatin opening around the variation.
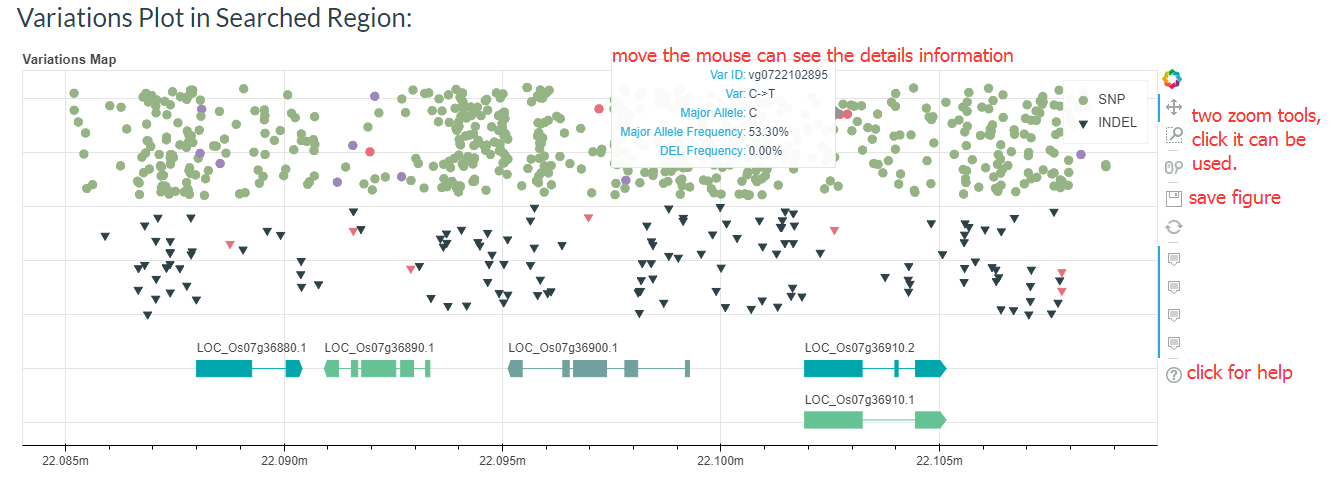
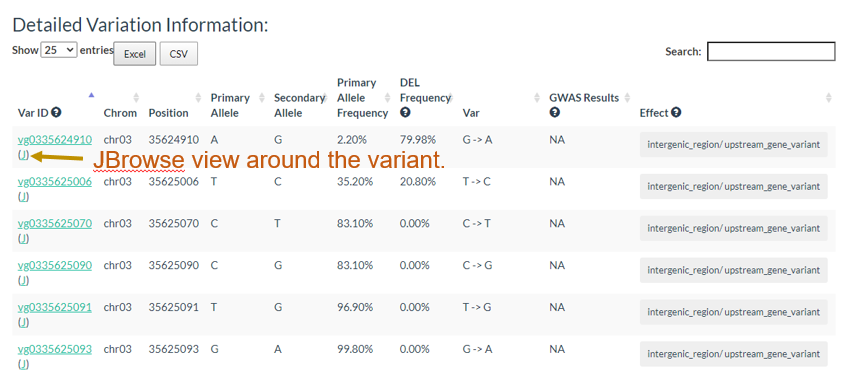
You can also find the regional variant map. You can click on the points in the map to go to the detailed variation information page.
And the results table is also can be sorted and searched.
3. How to search genotype with variation ID? top
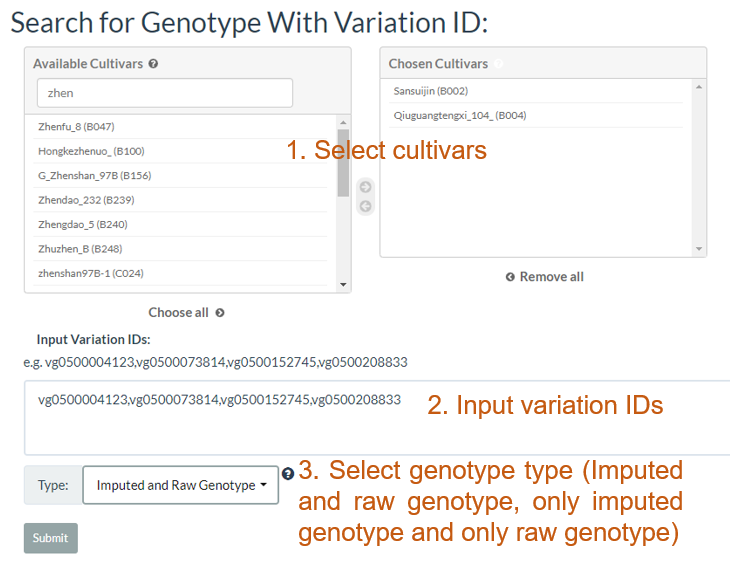
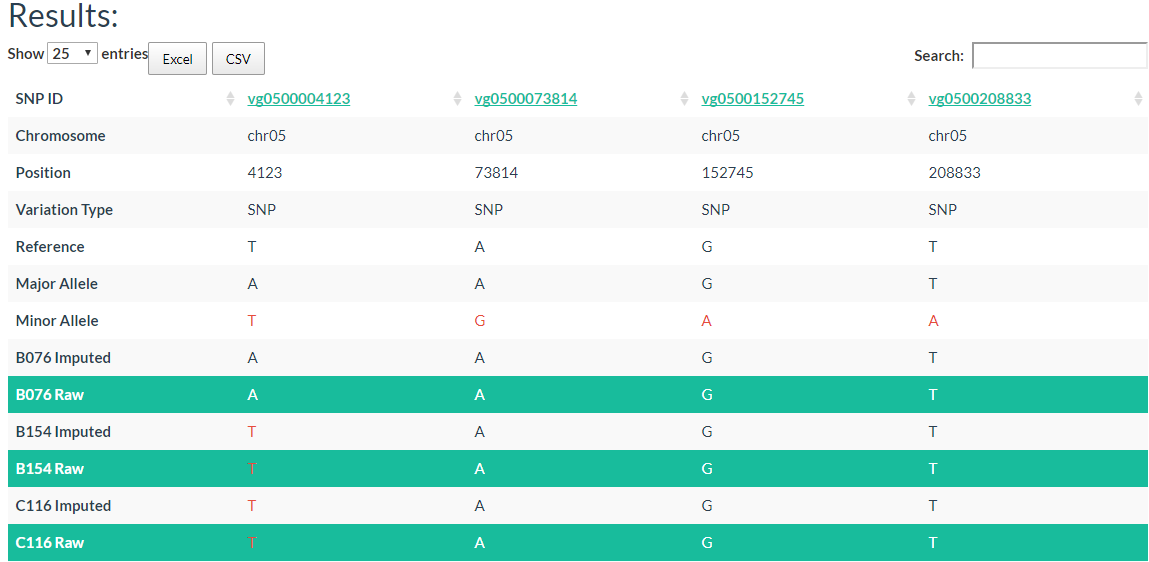
In the table, each column represents one variant. The table contains chromosome, locus, variant type (SNP/INDEL), reference allele, major allele, and minor allele information. An allele in red indicates a minor allele, and a background color in green indicates a raw genotype (not imputed).
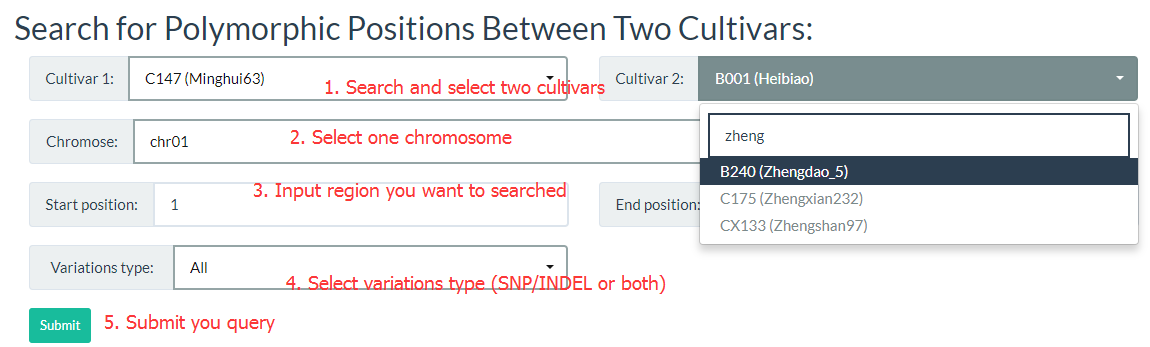
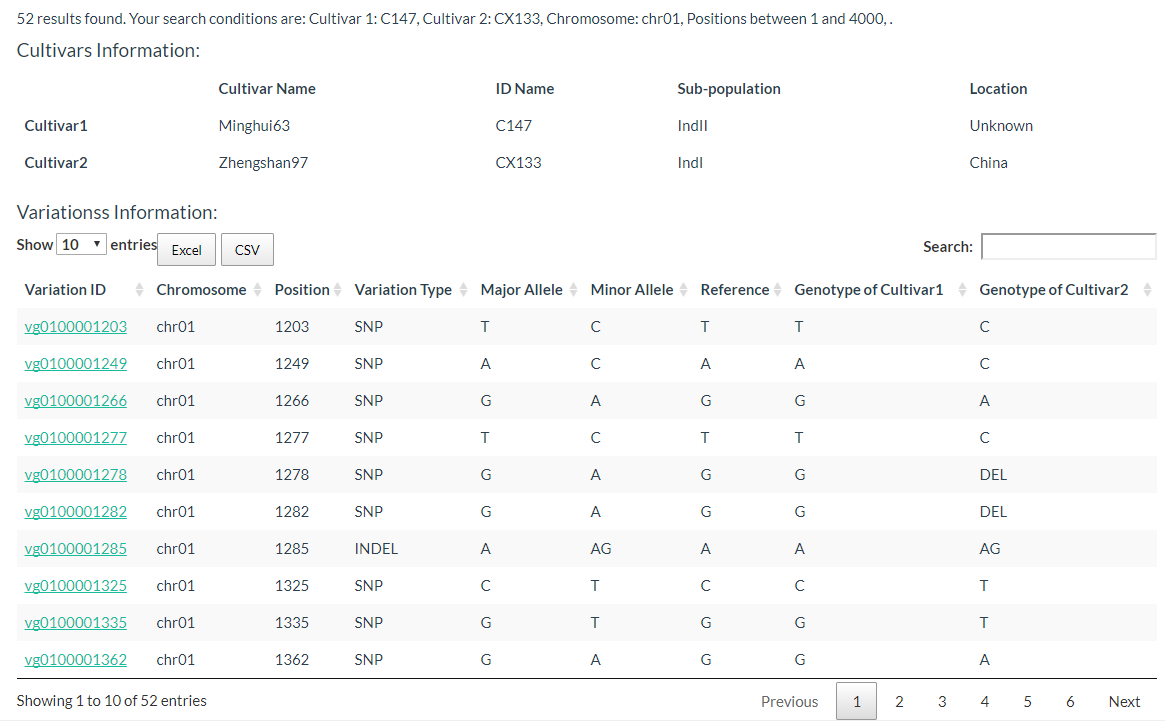
4. How to search for polymorphic positions between two cultivars? top
By entering keywords, you can search for cultivars and reduce selection time. The detailed steps are shown in the figure below.
The results are presented in two tables, the first table include cultivar information, which includes cultivar name, ID name in the database, subpopulation information, and location information. The second table contains the genotypes of the two selected cultivars.
5. How to search for variation information with variation ID? top
In this link, you just need to enter one variation ID to get the result.
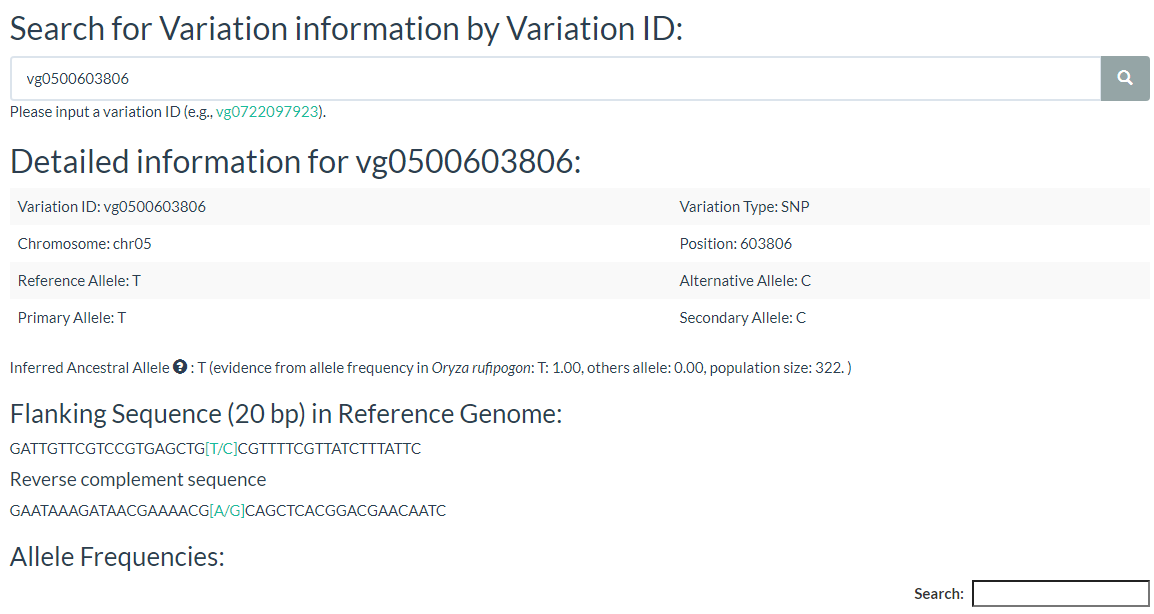
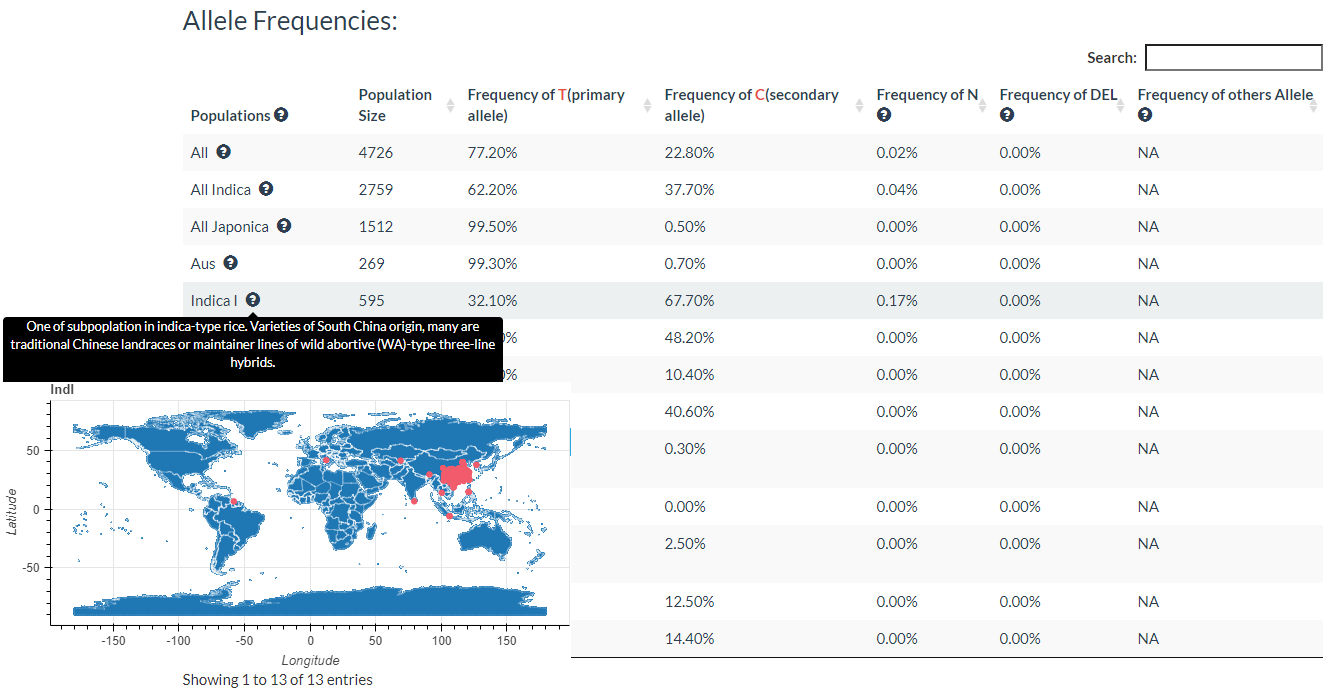
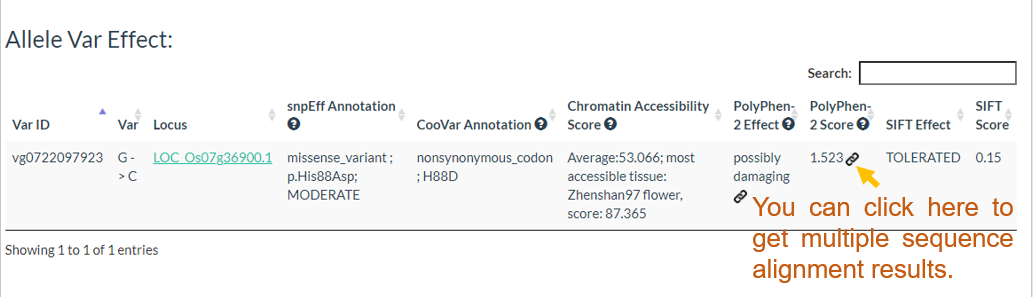
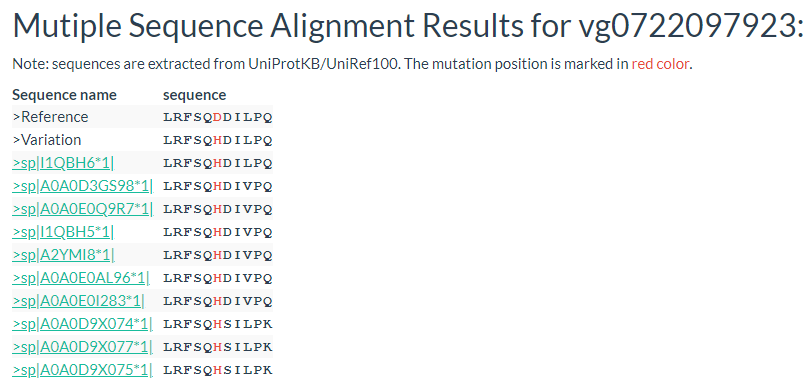
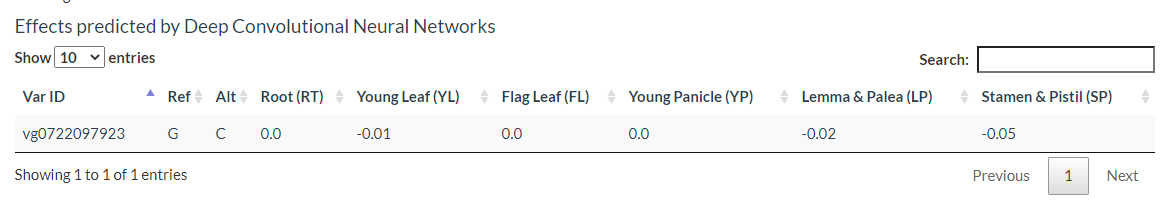
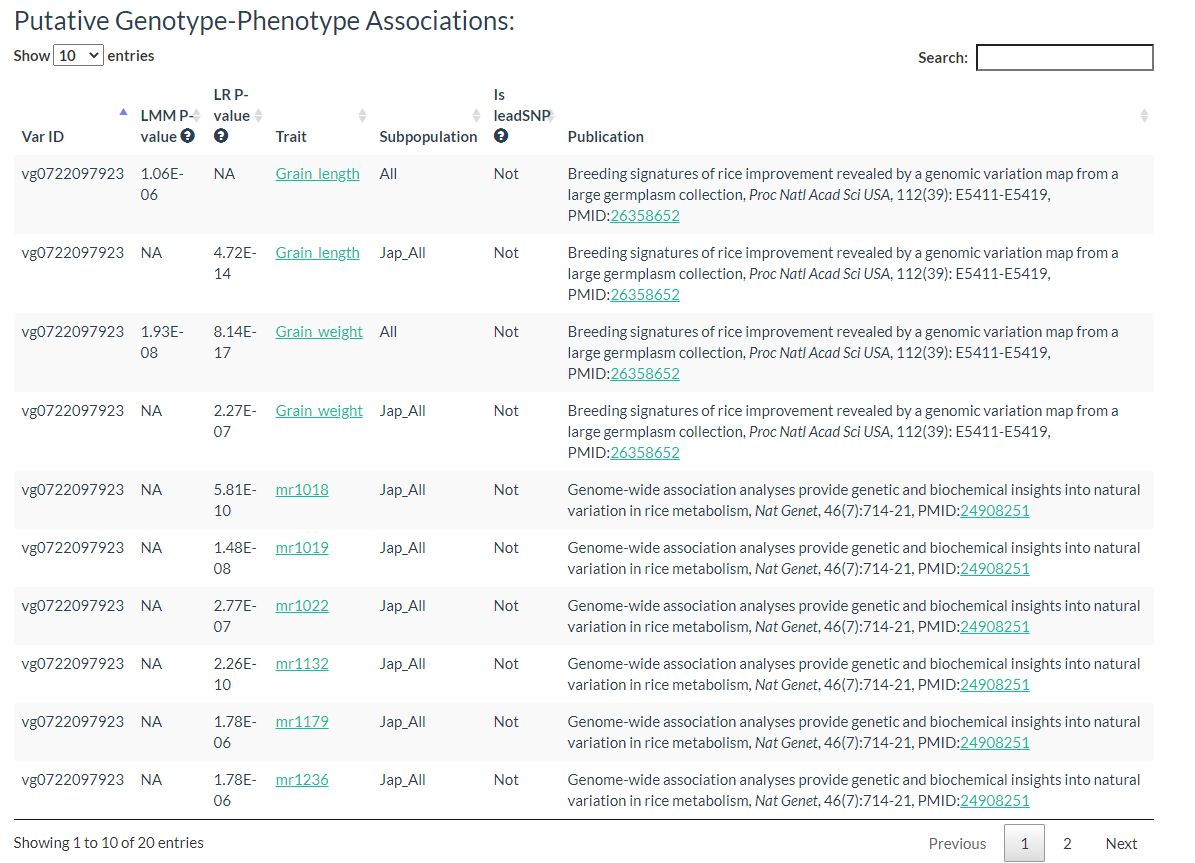
Results include flanking sequence (20 bp) around the variation, allele frequencies for each population, predicted effects of the variation, and GWAS results for the variation.
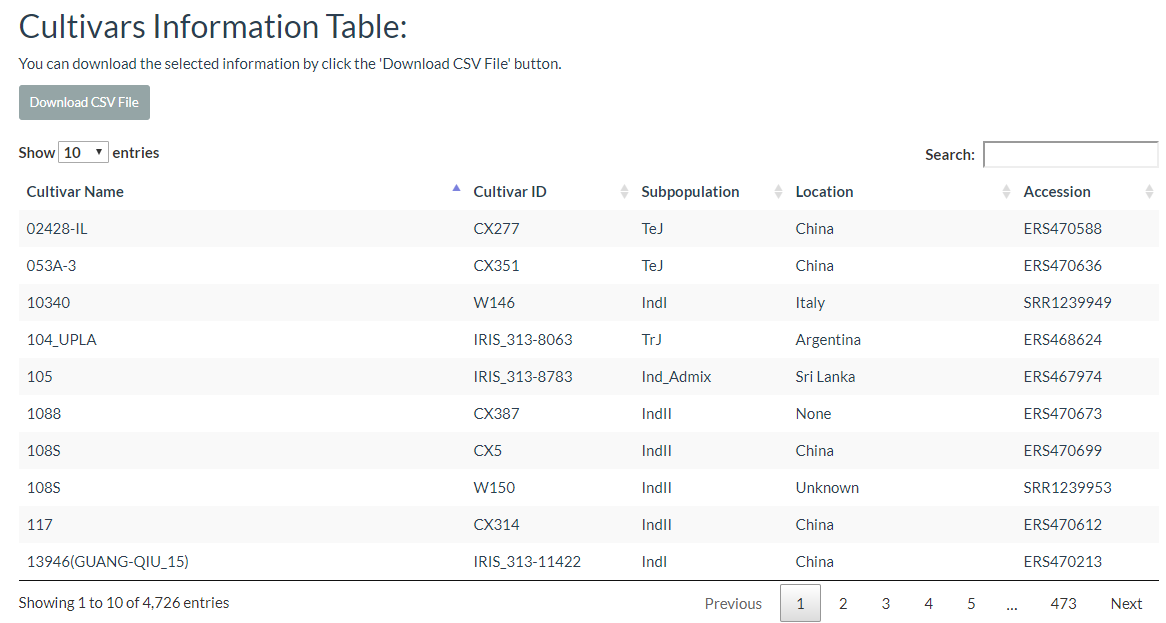
6. How to search cultivar information? top
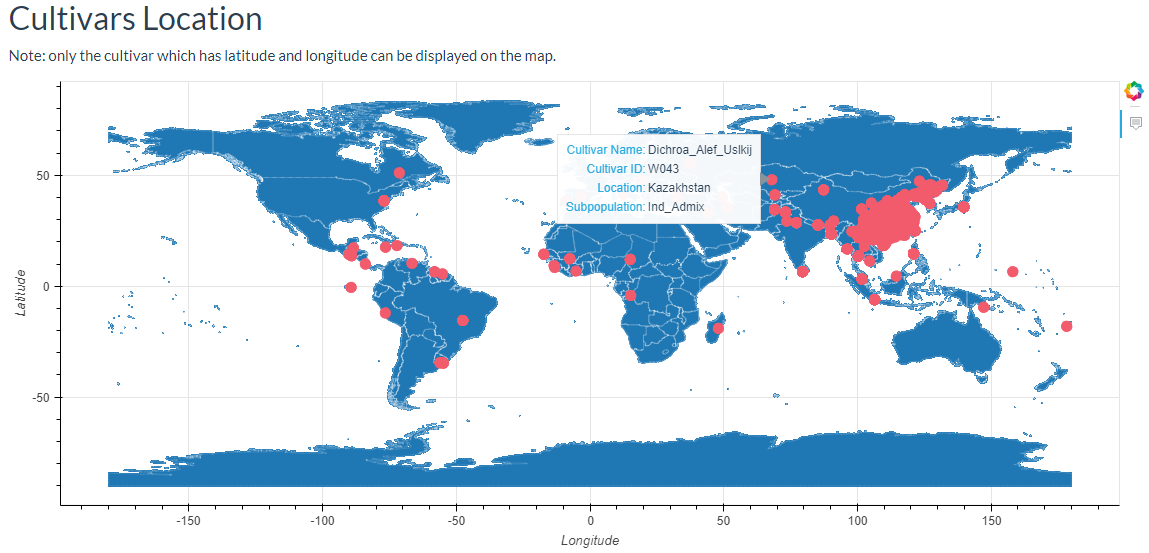
In this link, cultivars can be selected and the results will output the cultivars location image and the detailed information table.
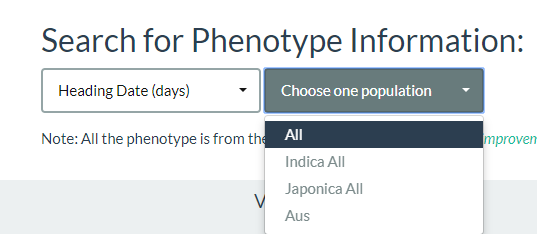
7. How to search phenotype information? top
By using this link, first, you should select one phenotype name, and then choose one population. Up to now, we collected 13 agronomic traits (including heading date, plant height, and grain weight et al.) and 840 metabolite traits (Xie et al., 2015, Proc Natl Acad Sci USA, 112: E5411-E5419; Chen et al., 2014, Nat Genet, 46:714-721).
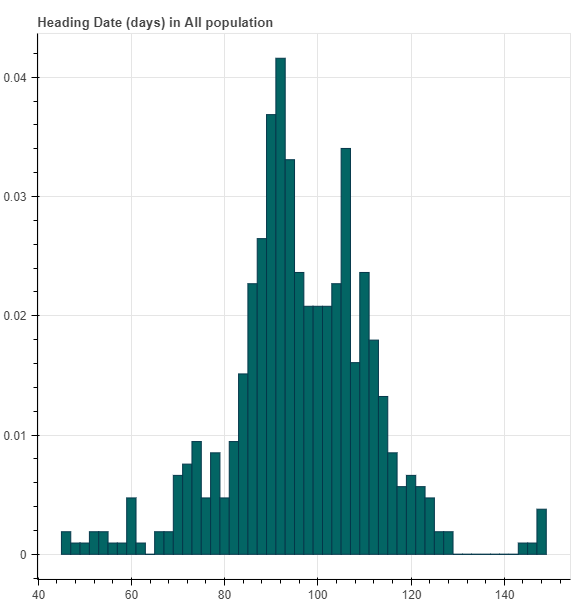
For each phenotype, we first draw a histogram of the phenotype distribution.
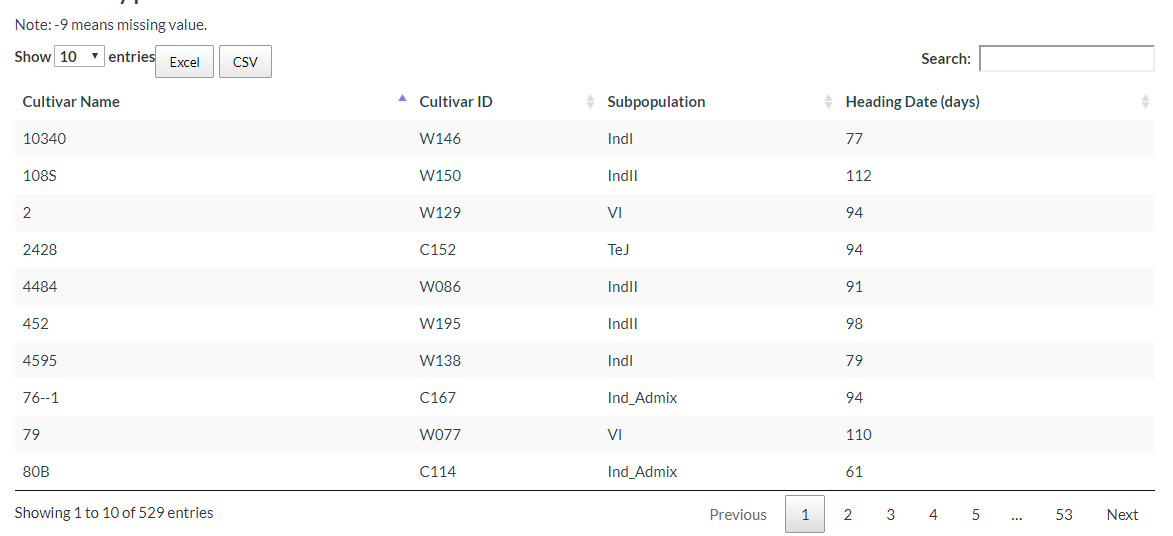
Phenotype information sheets for each cultivar are also available for download.
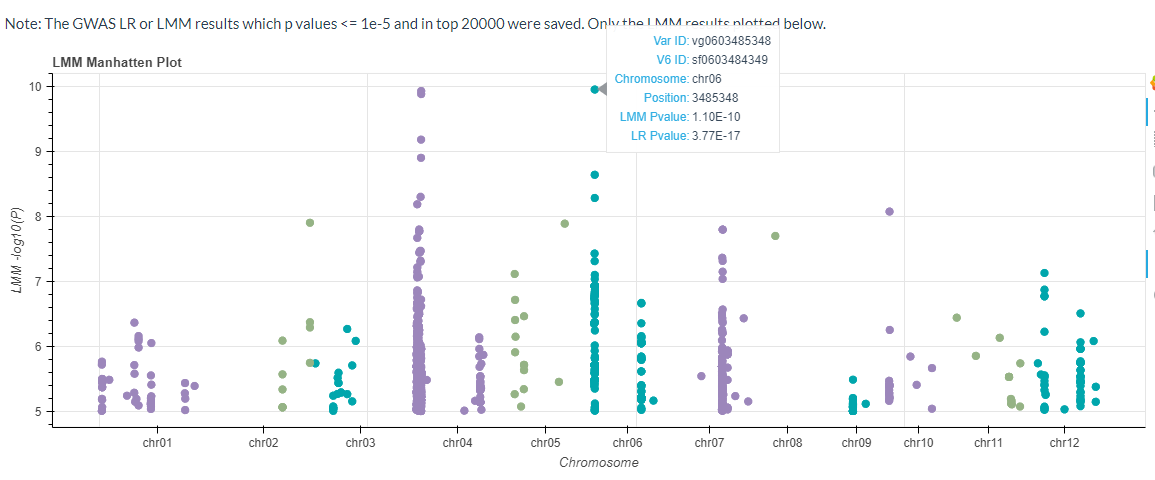
The GWAS results for the mixed linear model will also be plotted (p-values <= 1e-5 or p-values ranked in the top 20,000).
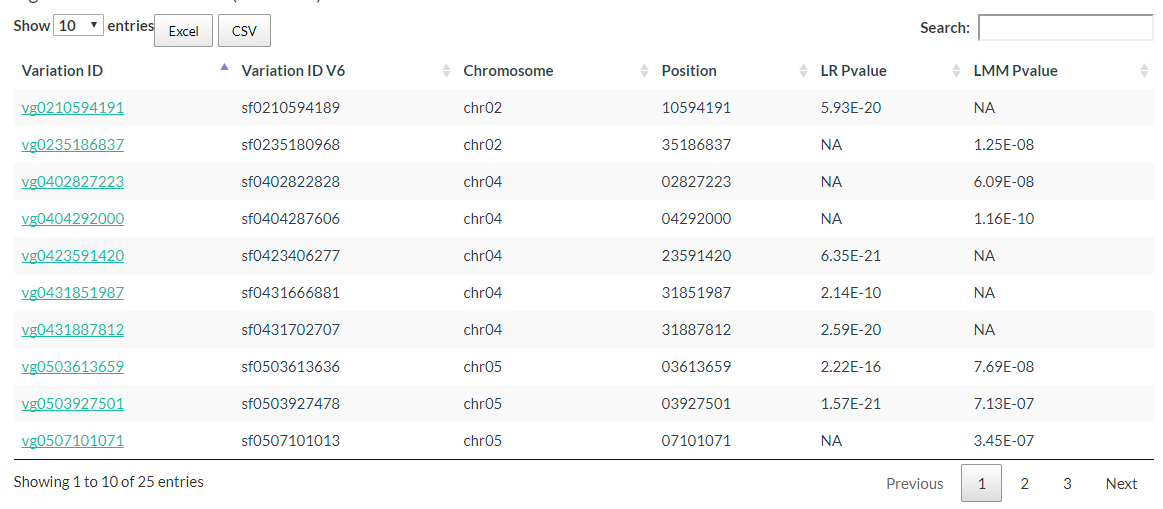
The Significant Candidate Loci information can also be downloaded.
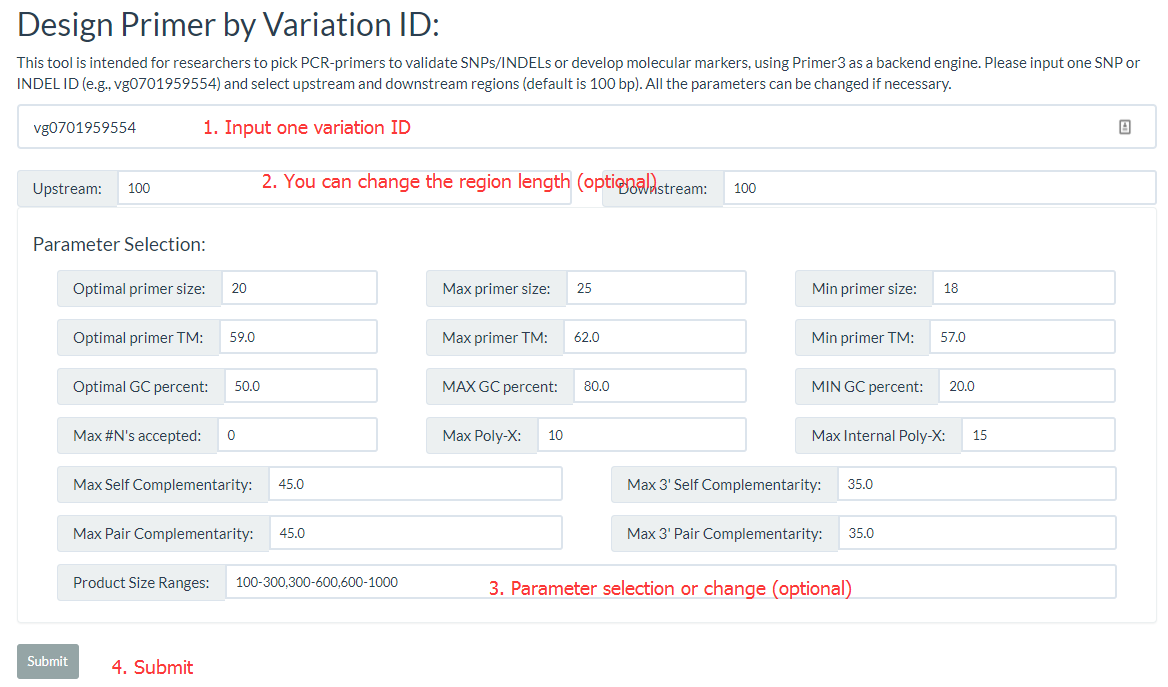
8. How to design primer by using RiceVarMap? top
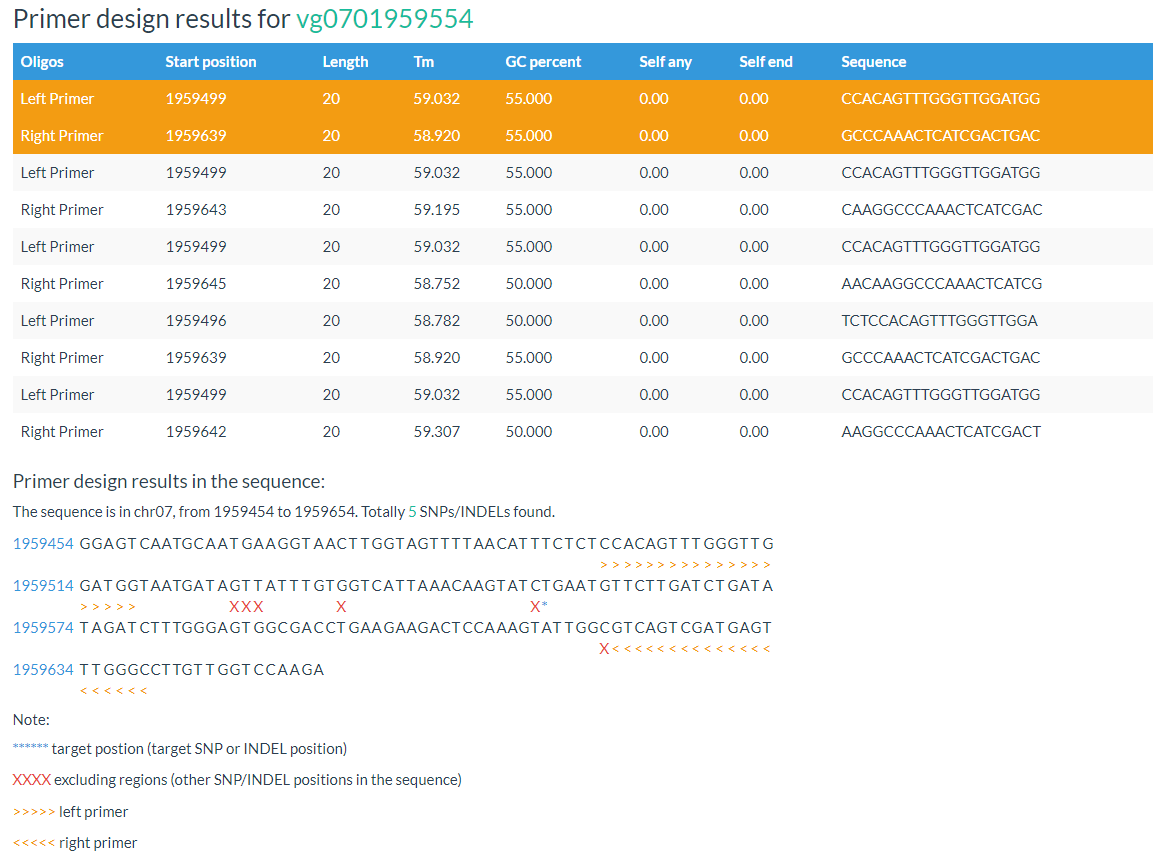
The 'Design Primer by Variation ID' is designed to allow researchers to select PCR-primers to validate SNPs/INDELs or develop molecular markers. The 'Design Primer by Region' is designed to allow researchers to select PCR-primers to amplify genomic regions to avoid overlap with known SNPs/INDELs. They all use Primer3 as a backend engine.
Both primer positions and variation positions are indicated in the results.
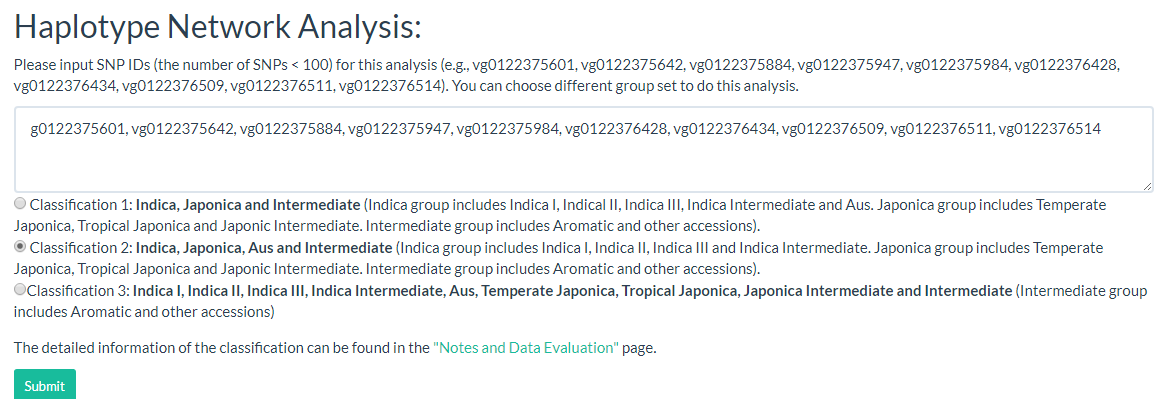
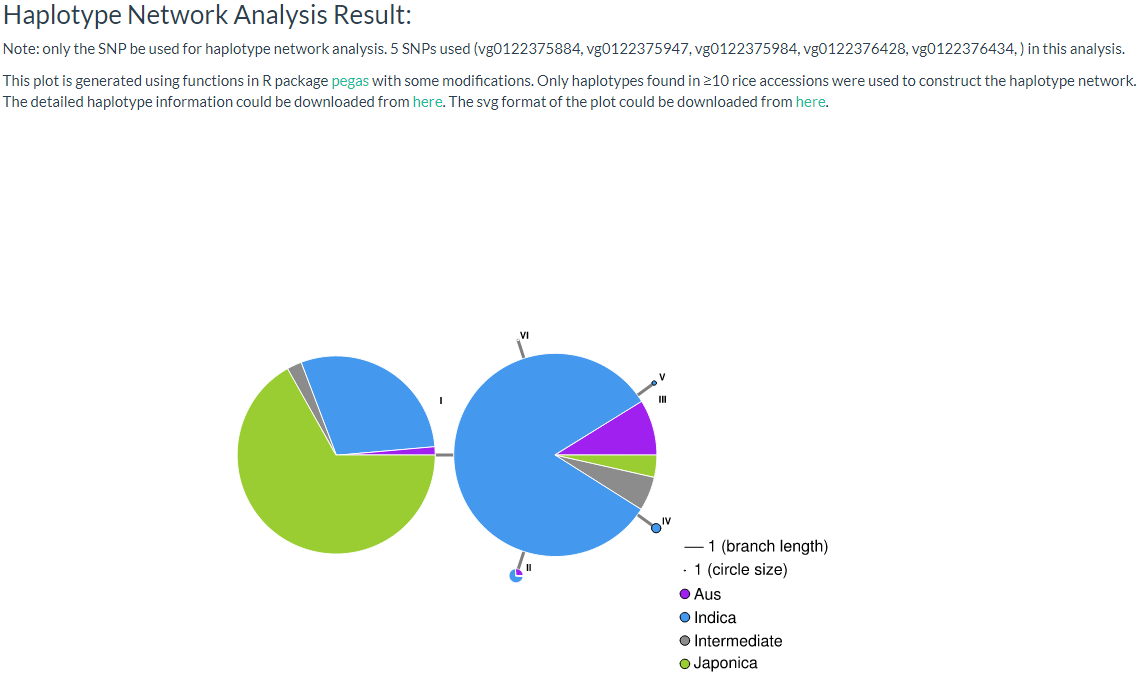
9. How to do haplotype network analysis? top
Haplotype networks are frequently used for population genetic analysis, and in this page we can enter the selected variant ID (must be SNP, INDEL will be filtered out) and select a population category for haplotype analysis. The user can download CSV and SVG files for further analysis (the page link).
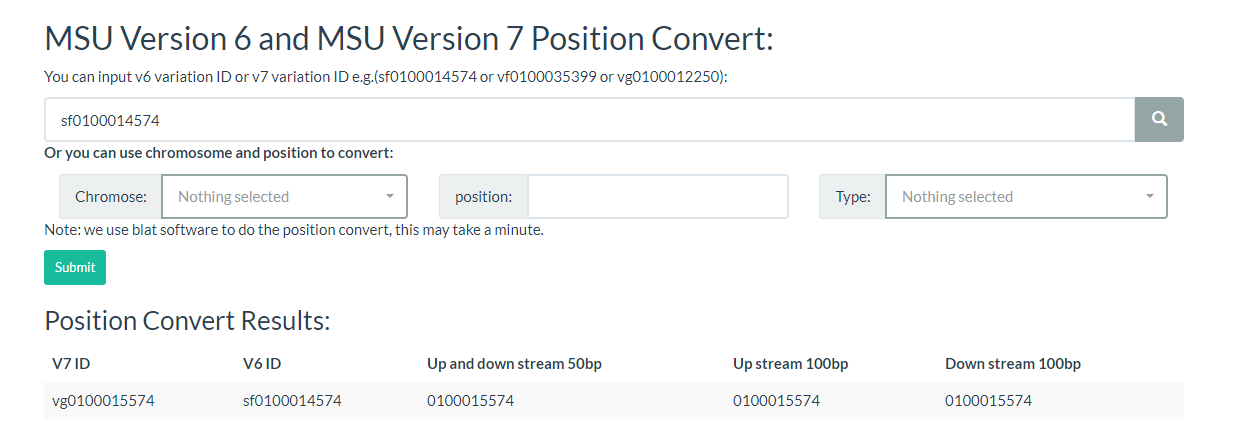
10. How to convert RiceVarMap v1 ID to v2 ID (or v2 ID to V1 ID)? top
All you need to do is enter a variation ID or chromosome location to convert the mutation ID on this page.
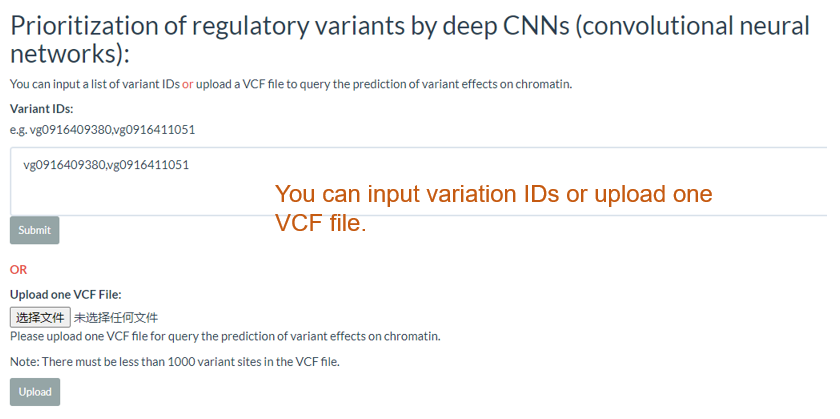
11. Prioritization of regulatory variants by deep CNNs (convolutional neural networks) top
You can input a list of variant IDs or upload a VCF file to query the prediction of variant effects on chromatin.
The results include the predicted effect value of the variant in each tissue as well as the degree of chromatin accessibility visualized in each tissue, the effect of the variation, and the gene model.

12. How to search QTN information in RiceNavi? top
Input your interested gene, e.g. Gn1a in Search for Variation by Gene page

The results:

In addition, you can click on the variant ID for detailed information.
Updated: 2022/6/10