Details of genotype data processing
Sequence alignment and variation identification
The assembly release version 7.0 of genomic pseudomolecules of japonica cv. Nipponbare was downloaded from Michigan State University and used as the reference genome. Reads of all varieties were aligned to the pseudomolecules using the software BWA v0.7.12-r1039. SNPs/INDELs were identified using GATK v3.3-0-g37228af. We first map the reads to the reference with BWA mem and then Generate GVCF per-sample with HaplotypeCaller (with parameters of -T HaplotypeCaller --emitRefConfidence GVCF --variant_index_type LINEAR --variant_index_parameter 128000, mapping quality ≥20 were used), after creating the GVCF file, we use CombineGVCFs to generate VCF file. The variations identified by GATK were further filtered: the allele count in VCF file must >10, depth must >=50.
Imputing missing genotype using an LD-KNN algorithm
After obtaining raw genotype calls from GATK, 33.4% of genotypes were missing due to low-coverage sequencing. We then performed imputation using an in-house modified k nearest neighbor algorithm. In imputation, heterozygous calls were set to missing and we split the variations to 4058 bins (5000 variations each) for imputation. For the missing genotype in high coverage regions, we set them to be 'DEL'. After imputation, we obtained an overall missing data rate reduced to 2.32% and an overall DEL rate to 9.57%. The detailed precision rate and missing rate of each bin after imputation are shown in the figure below.

Figure 1. Precision rate statistic after imputation
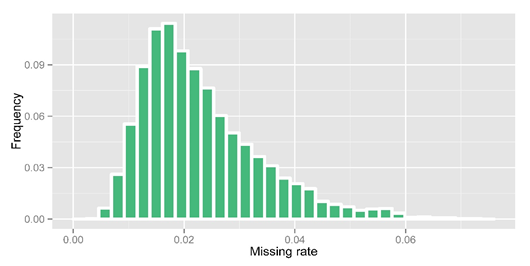
Figure 2. Missing rate statistic after imputation
Data evaluation
To estimate the accuracy of imputed genotype, we genotyped 50 accessions using Illumina Infinium array RiceSNP50. There are 41709 high-quality SNP markers in the array and 41709 SNPs covered by the RiceVarMap v2 well-imputed SNPs. The accuracy of Infinium array is proved. Thus, the concordance of genotypes using array hybridization and sequencing can be used to estimate the accuracy of raw genotypes from direct sequencing and after imputation. The results suggested an accuracy of 99.9% for raw genotypes and 99.8% for genotypes after imputation (Table 1).
Table 1. Concordance between genotyping results of array hybridization and sequencing on 41709 SNPs.
| ID | Raw Prop. Concordance | Raw Num. Concordance | Raw Num. Difference | Imputed Prop. Concordance | Imputed Num. Concordance | Imputed Num. Difference |
|---|---|---|---|---|---|---|
| C146 | 0.9999443 | 35902 | 2 | 0.9999519 | 41606 | 2 |
| C048 | 0.9998581 | 35222 | 5 | 0.999344 | 41132 | 27 |
| C056 | 0.9997714 | 34987 | 8 | 0.9994436 | 41314 | 23 |
| C149 | 0.99974 | 34606 | 9 | 0.9993461 | 41265 | 27 |
| C052 | 0.9997377 | 34301 | 9 | 0.9994166 | 41117 | 24 |
| C026 | 0.9997359 | 34075 | 9 | 0.9994922 | 41333 | 21 |
| C016 | 0.9997203 | 35738 | 10 | 0.9990028 | 41073 | 41 |
| C063 | 0.9997072 | 34145 | 10 | 0.9989585 | 41244 |
43 |
| C116 | 0.9996554 | 34807 | 12 | 0.9993704 | 41273 | 26 |
| C101 | 0.9996047 | 32875 | 13 | 0.996908 | 40624 | 126 |
| C070 | 0.9995361 | 32870 | 14 | 0.999153 | 40613 | 127 |
| C087 | 0.9995227 | 33504 | 16 | 0.9981672 | 40846 | 75 |
| C079 | 0.9995153 | 32992 | 16 | 0.997913 | 40643 | 85 |
| C130 | 0.9994939 | 33573 | 17 | 0.9975975 | 40692 | 98 |
| C028 | 0.9994919 | 35407 | 18 | 0.9992482 | 41203 | 31 |
| C082 | 0.9994542 | 32960 | 18 | 0.9975939 | 40632 | 98 |
| C152 | 0.999408 | 33765 | 20 | 0.9983384 | 40857 | 68 |
| C067 | 0.9994021 | 33433 | 20 | 0.9981647 | 40791 | 75 |
| C144 | 0.9993756 | 33613 | 21 | 0.9974241 | 40658 | 105 |
| C071 | 0.999375 | 33578 | 21 | 0.9982623 | 40787 | 71 |
| C106 | 0.9993459 | 33612 | 22 | 0.9972781 | 40670 | 111 |
| C035 | 0.9993267 | 34136 | 23 | 0.9973952 | 40588 | 106 |
| C023 | 0.9993248 | 34041 | 23 | 0.9970509 | 40570 | 120 |
| W249 | 0.999283 | 34841 | 25 | 0.9989298 | 41068 |
44 |
| C034 | 0.9992642 | 33952 | 25 | 0.9973746 | 40649 | 107 |
| C010 | 0.9992524 | 33414 | 25 | 0.9983731 | 40501 | 66 |
| C003 | 0.999236 | 34006 | 26 | 0.9978706 | 40301 | 86 |
| W006 | 0.9992323 | 35145 | 27 | 0.9985201 | 40484 | 60 |
| C029 | 0.9992306 | 33766 | 26 | 0.9984585 | 40806 | 63 |
| C074 | 0.9992114 | 32942 | 26 | 0.9971664 | 40469 | 115 |
| C083 | 0.9992 | 32475 | 26 | 0.9964222 | 40104 | 144 |
| C123 | 0.9991879 | 33220 | 27 | 0.9981806 | 40598 | 74 |
| C111 | 0.9991183 | 33994 | 30 | 0.9970075 | 40647 | 122 |
| C137 | 0.9991066 | 33548 | 30 | 0.9975201 | 40626 | 101 |
| C014 | 0.9990678 | 33222 | 31 | 0.9981316 | 40600 | 76 |
| C004 | 0.9989958 | 34818 | 35 | 0.9970967 | 40525 | 118 |
| C119 | 0.9988537 | 33112 | 38 | 0.9978975 | 40818 | 86 |
| W225 | 0.9988271 | 33211 | 39 | 0.9976852 | 40514 | 94 |
| C153 | 0.9988045 | 32582 | 39 | 0.9982033 | 40557 | 73 |
| C005 | 0.9987718 | 33342 | 41 | 0.9979786 | 40484 | 82 |
| C051 | 0.9987332 | 32323 | 41 | 0.9974401 | 40523 | 104 |
| C002 | 0.9986189 | 32538 | 45 | 0.9973611 | 39685 | 105 |
| W252 | 0.9985072 | 32776 | 49 | 0.9970285 | 39592 | 118 |
| W251 | 0.998462 | 33758 | 52 | 0.9975101 | 40463 | 101 |
| C134 | 0.9975806 | 34636 | 84 | 0.9961547 | 40672 | 157 |
| C145 | 0.9972605 | 29122 | 80 | 0.9946713 | 39759 | 213 |
| C059 | 0.997162 | 28460 | 81 | 0.9944998 | 39417 | 218 |
| C151 | 0.99716 | 28440 | 81 | 0.9946527 | 39434 | 212 |
| Total | 0.999129 | 1675414 | 1415 | 0.997853 | 2032184 | 4413 |
The genetic structure and diversity of the rice germplasms
The population structure of the 4,726 accessions was inferred using ADMIXTURE based on 210,521 SNPs randomly selected from the genome (3 SNPs randomly selected every 5 kb and MAF must >= 0.01). The parameter for the number of ancient clusters K was set from 2 to 7 to obtain different inferences. Each accession was classified based on its maximum subpopulation component. Accessions with the maximum subpopulation component value differing from the second value less than 0.4 were classified as intermediate.
When K=2, accessions were divided into indica and japonica varietal groups.
At K=3, the aus cluster (Aus) appeared within the indica varietal group.
At K=4, the indica were further divided into two sub groups (indica I and indica III, also denote as IndI and IndIII), indica accessions with similar components of IndI and IndIII (<0.4) were classified as Indica Intermediate.
At K=5, the indI were further divided into two sub groups (indica I and indica II, also denote as IndI and IndII), indica accessions with similar components of IndI and IndII (<0.4) were classified as Indica Intermediate.
At K=6, japonica was divided into two sub groups, corresponding to tropical japonica (TrJ) and temperate japonica (TeJ), japonica accessions with similar components of TeJ and TrJ (<0.4) were classified as Japonica Intermediate.
At K=7, an independent group (VI) emerged, which is an intermediate group between indica and japonica. Only fourteen accessions belonged to VI and we found that nine of them were with mutated fragrance gene fgr, which suggested that VI is corresponding to Group V/Aromatic group reported in other studies (Glaszmann et al. Theor Appl Genet, 1987, 74: 21-30; 1. Garris et al. Genetics, 2005, 169: 1631-1638).
The set of 4729 rice accessions sequenced in this study was accordingly classified into 595 IndI, 465 IndII, 913 IndIII, 786 indica intermediate, 767 TeJ, 504 TrJ, 241 japonica intermediate, 269 Aus, 96 VI, and 90 intermediate, The details of classification and values of subpopulation component can be queried in Cultivar Information page.

Figure 3. Neighbor-joining tree of 4729 accessions constructed from matching the distance of 210,521 even-distributed and randomly selected SNPs. Different subpopulations, indica I (IndI), indica II (IndII), Indica III (IndIII), Aus, temperate japonica (TeJ) and tropical japonica (TrJ) are shown in different color and the numbers of accessions in each subpopulation are marked. In this figure, the number of accessions of Intermediate contains VI group (denotes in pink).
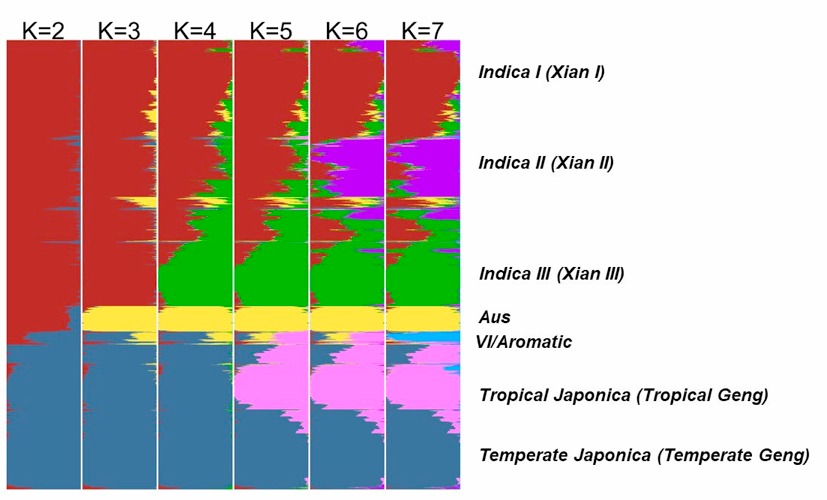
Figure 4. The distribution of the estimated subpopulation components for each accession analyzing by ADMIXTURE under different assumptions of ancient clusters K = 2 to 7 for 4729 accessions.